But can a custom design offer a "carefree life" out of the box? At least in terms of cooling and noise it is possible as the ROG Strix GeForce RTX 3070 Ti OC Edition from ASUS proves.
Technical Specifications
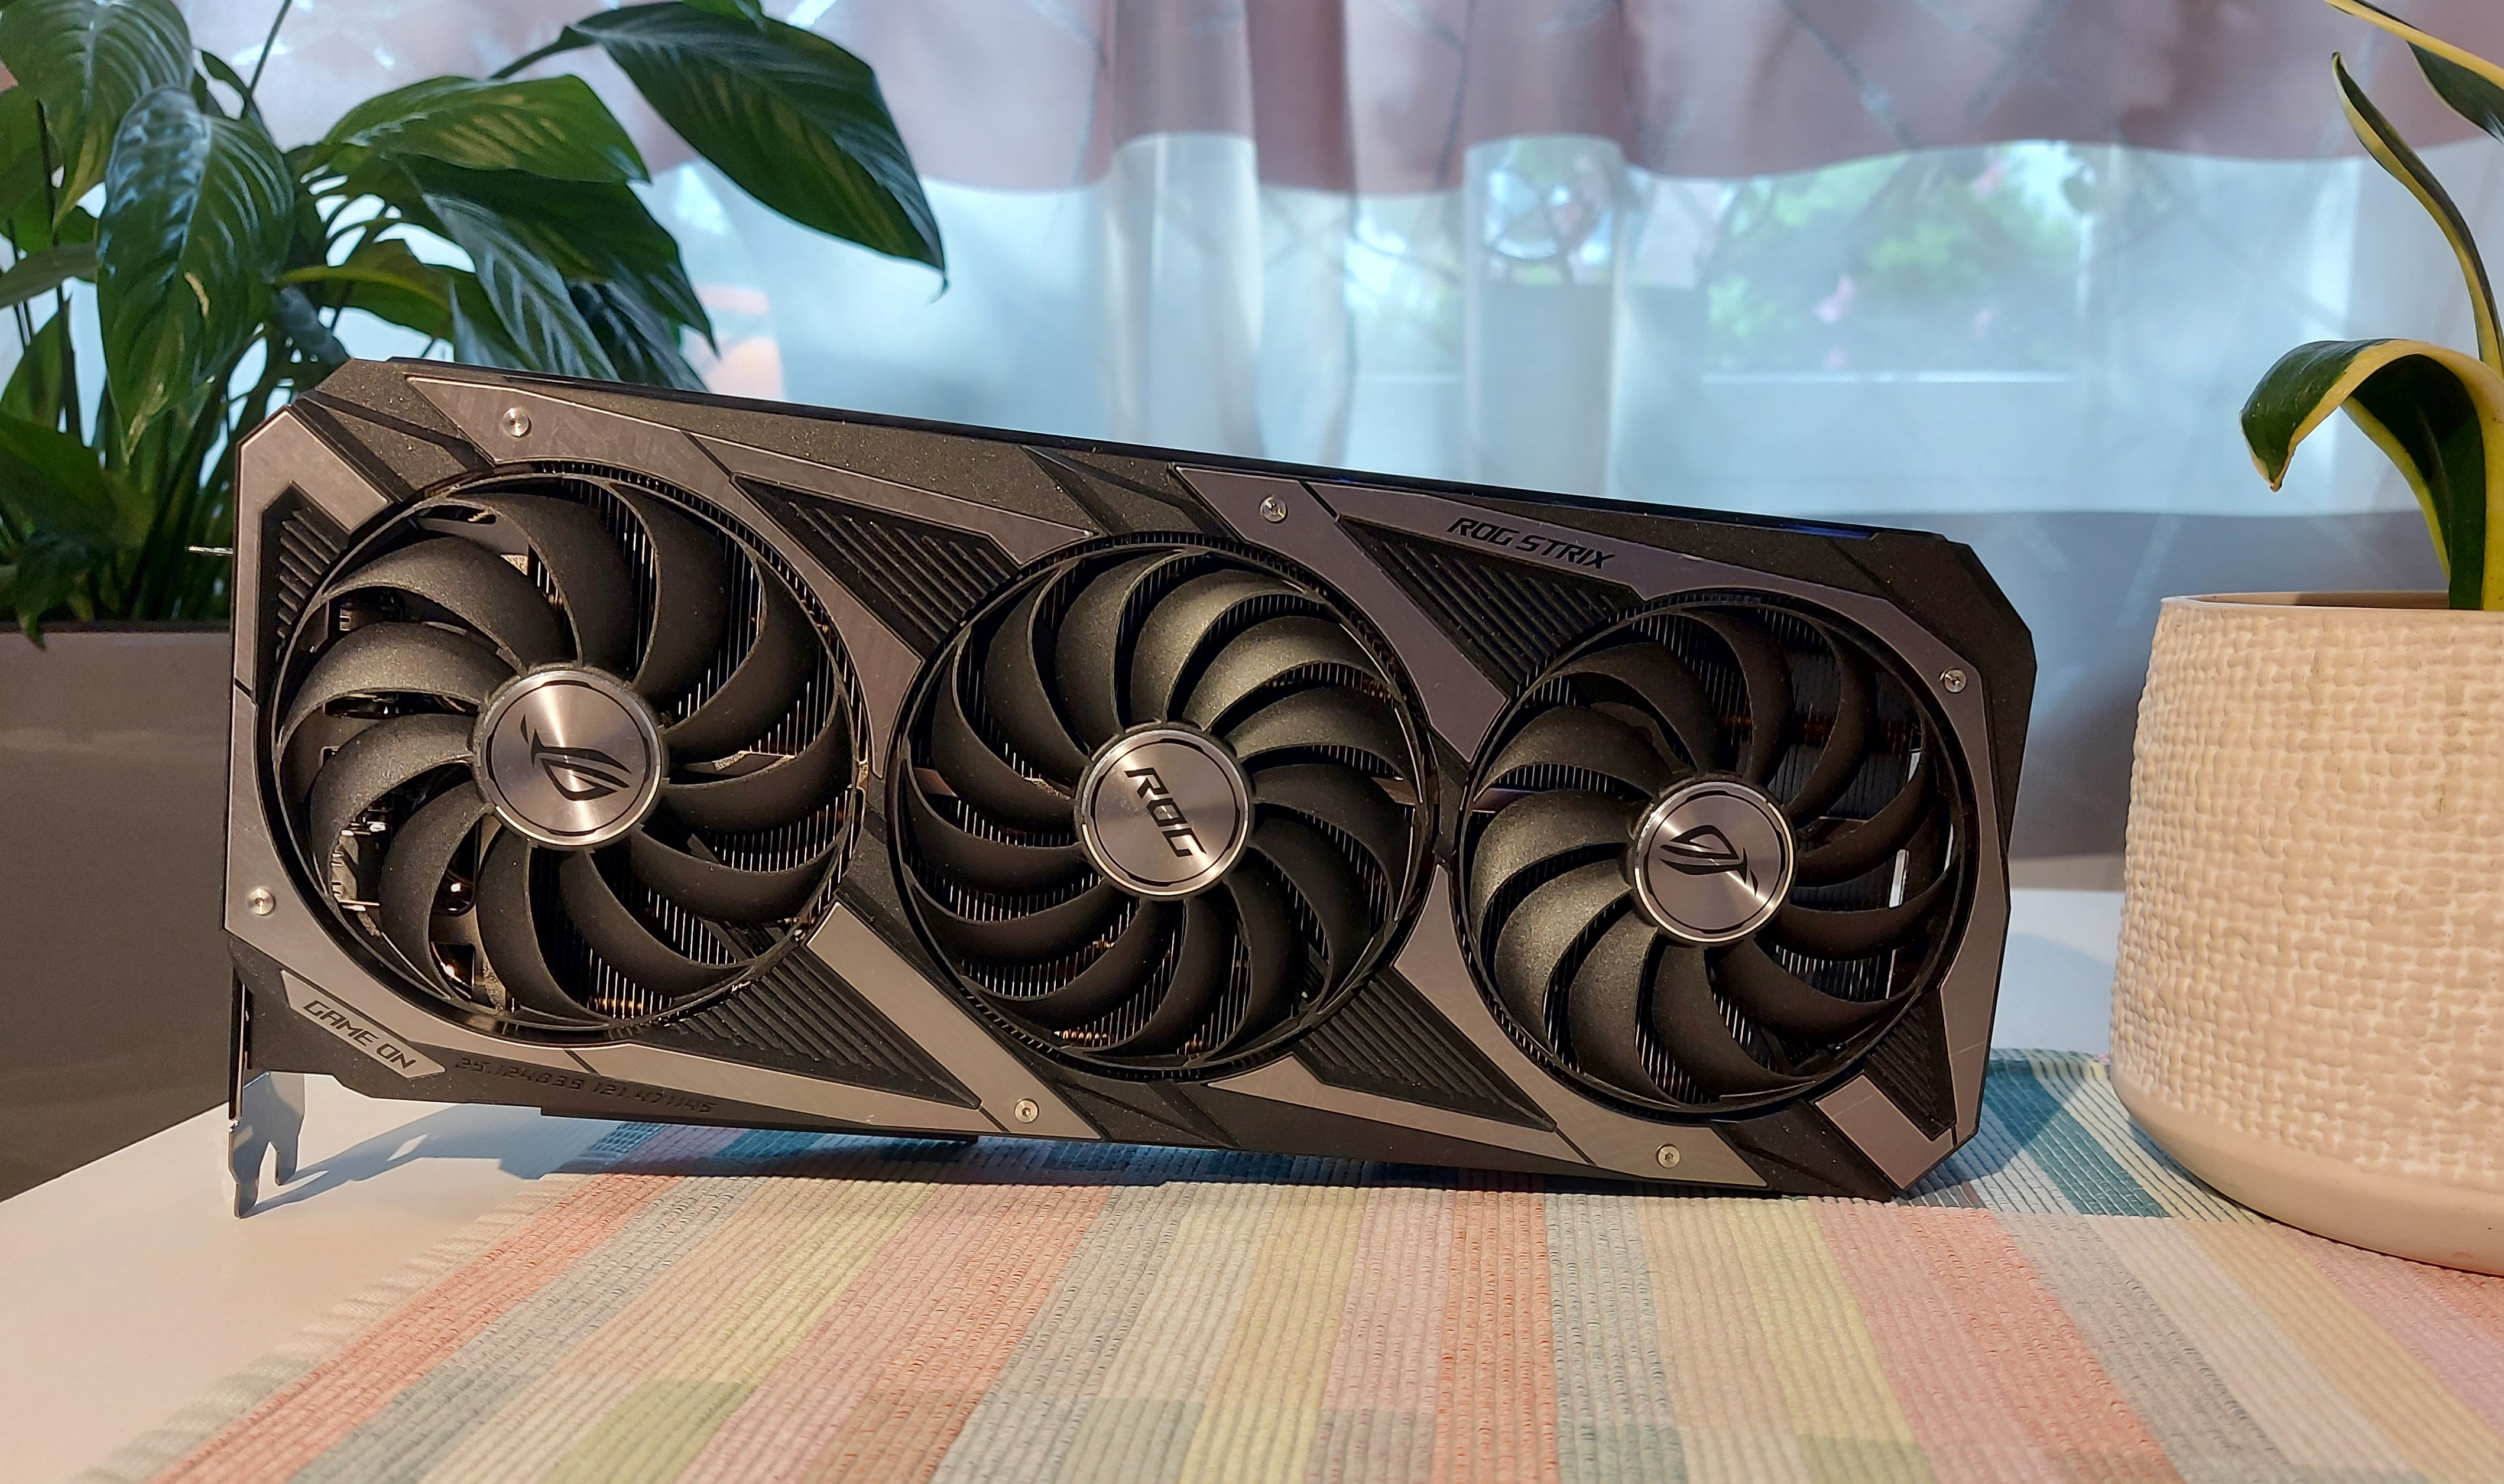
The ROG Strix GeForce RTX 3070 Ti relies on an abundant 2.9-slot design with 3 axial fans with the center fan operating in the opposite direction of rotation. The card is equipped with 10+2 phase VRMs and 3x8 pin power connectors. The total length is 31.85cm which means that the case must be adequately dimensioned. It is definitely advisable to check this thoroughly before buying a graphics card.
| Model Name | ROG-STRIX-RTX3070TI-O8G-GAMING |
|---|---|
| GPU | GA104-400 |
| Process Node | Samsung 8 nm |
| Die Size | 392 mm² |
| Transistors | 17.4 billion |
| CUDA Cores | 6144 |
| TMUs/ROPs | 192/96 |
| Tensor/RT | 192/48 |
| Base Clock | 1575 |
| Boost Clock | OC mode: 1875 MHz Gaming mode: 1845 MHz |
| Memory | 8GB GDDR6X |
| Interface | 256-bit |
| Memory Clock | 1188 MHz (19 Gbps effective) |
| Bandwidth | 608.3 GB/s |
| Bus Interface | PCIe 4.0 x16 |
Exterior
In order to better compare the size of the card a Red Devil Limited Edition RX 6800 XT from PowerColor is (partially) included in the following pictures. Especially when viewed from the direction of the IO shield, you can see how massive ASUS has designed the cooler. The case is made of metal and plastic. Additional metal decorations on the front completes the picture of a very high-quality design.
Stress test with FurMark
In order to test the cooler's performance under load FurMark with default settings was used. Such a high load is not reached in normal everyday gaming, so the test serves to better assess the worst case. From a purely theoretical point of view cryptographic algorithms for mining cryptocurrencies can stress the VRAM even more. In terms of gaming scenarios, however, this is even more unrealistic than FurMark itself.
| Telemetry RTX 3070 Ti | Q-BIOS | P-BIOS | ||||
|---|---|---|---|---|---|---|
| Min | Average | Max | Min | Average | Max | |
| GPU Core (MHz) | 1665 | 1696 | 1740 | 1650 | 1704 | 1830 |
| GPU Memory (Gbps) | 19004 | 19004 | 19004 | 19004 | 19004 | 19004 |
| GPU Fan (%) | 0 | 59 | 60 | 0 | 69 | 71 |
| GPU Power Limit | 1 | 1 | 1 | 1 | 1 | 1 |
| GPU Fan (RPM) | 0 | 1254 | 1300 | 0 | 1690 | 1763 |
| GPU Core (%) | 86 | 99 | 99 | 89 | 99 | 99 |
| GPU Limit Time (%) | 100 | 100 | 100 | 100 | 100 | 100 |
| GPU Power (W) | 290.8 | 309.1 | 323.2 | 263.3 | 309 | 318.2 |
| GPU Core (°C) | 62 | 71 | 72 | 58 | 65 | 66 |
| GPU Hot Spot (°C) | 72 | 82 | 83 | 68 | 76 | 77 |
| GPU Memory Junction (°C) | 64 | 81 | 82 | 58 | 76 | 76 |
| GPU Voltage (V) | 0.86 | 0.88 | 0.89 | 0.86 | 0.88 | 0.96 |
The most important telemetry data (min, avg, max) is compared in relation to the Q- and P-BIOS. The power consumption with Q-BIOS enabled should normally be about 290W but no difference could be measured even in games. What is different on the other hand are fan speed and temperatures. With Q-BIOS the card is significantly quieter but also a bit hotter. Maximum hotspot temperatures at just over 80°C are excellent and far from critical states. The small difference between the GPU core and GPU hotspot temperature of about 10°C is respectable. The cooler does a very good job overall and is definitely one of the strengths of the ROG Strix GeForce RTX 3070 Ti.
Methodology
The frame times were captured with CapFrameX in version v1.6.5.
Configuration of CX
- Overlay refresh rate 1000ms
- Auto-disable OSD enabled
- Run History and Aggregation enabled
- Error margin 3%
- 2-3 valid runs with a duration of 20 seconds = 1 valid session
- Sensor logging enabled with a refresh rate of 500ms
- Default configuration of sensor logging extended by hotspot temperatures, GPU voltage, fan values and VRAM usage (dedicated + shared).
**Gaming Settings
- Resolutions: 1080p, 1440p, 3840x1600
- Raytracing was always combined with DLSS Ultra.
- If Ultra settings cause an excessive performance loss relative to image quality, settings were reduced to High.
Overall demanding custom scenes were used to provide a lower bound for performance.
Metrics
- Average FPS
- 1% percentile, which is not sensitive to reproducible and especially random outliers.
Test System
An open test bench without further active cooling was used for the gaming benchmarks. The board is mounted horizontally on the test bench. A be quiet! Dark Power Pro 650 watt power supply provided the components with power. The Ryzen 9 5900X ran on a Gigabyte X570 Aorus Master with BIOS version F34. The CPU was cooled with the Noctua NH-D15 chromax.black. 4x8GB G.Skill F4-3200C14D-16GTZR (2 kits) with CL14-14-14-30 1T was used.
Benchmark Suite
The benchmark suite used is focused on ray tracing, as RTX cards can show their strengths here. An exception to this is Hitman 3. In order to better assess the performance effort due to ray tracing Cyberpunk 2077 and The Ascent are also tested with ray tracing off. Metro Exodus Enhanced Edition is basically designed for ray tracing as a rendering technique. The feature can therefore not be disabled.
- Cyberpunk 2077
- Hitman 3
- Metro Exodus Enhanced Edition
- The Ascent
Gaming Performance at 1080p, 1440p and 3840x1600
Besides the standard resolutions Ultrawide is also covered in this review. This is quite interesting, because the question is whether a graphics card that doesn't belong to the enthusiast class is sufficient for an "almost" 4K resolution? 3840x1600 corresponds to about 74% of 4K. As a comparison, an RX 6800 XT is included so that the values don't float in a vacuum. It should be emphasized that the comparison is not supposed to represent a duel of the two cards. The performance classes are not directly comparable.
1080p Ray Tracing on

1080p Ray Tracing off

A few points are immediately noticeable here. The RX 6800 XT is not part of Cyberpunk 2077. The reason is simple and sad: the performance is simply not enough. Without suitable upscaling technology the frame rates are off the charts. The title needs FSR. The Ascent is also rather CPU-heavy in the tested scene. Thus, the RTX 3070 Ti cannot set itself apart even with DLSS. However, that changes as the resolution increases. The performance in Metro Exodus is very good and leaves plenty of room for higher resolutions or ray tracing levels.
Without ray tracing both cards offer more than enough performance. It is interesting that the RX 3070 Ti only drops relatively slightly with ray tracing enabled.
1440p Ray Tracing on
1440p Ray Tracing off

Even at 1440p the RTX 3070 Ti has room for tighter settings for sprucing up Metro Exodus. The Ascent barely breaks in because of a CPU limit at 1080p. Cyperpunk 2077 is close to the limits with just below 60 FPS on average when 60 FPS is the frame rate target.
Without ray tracing the RTX card offers a solid performance in all situations. Cyperpunk 2077 also runs sufficiently smooth with about 70 FPS.
3840x1600 Ray Tracing on

3840x1600 Ray Tracing off

Is the ROG Strix RTX 3070 Ti able to handle almost 4K when the user wants to run very demanding titles? Yes, it can and even with ray tracing enabled. Cyberpunk 2077 on the other hand is merciless. The title is not playable at 3840x1600 so the results are not listed. The same fate befalls the RX 6800 XT with The Ascent because playable frame rates are no longer possible here.
Without ray tracing the RTX card shows a superior performance except with Cyberpunk 2077 where the "secret weapon" DLSS can still be enabled while the Radeon card has to do all this without further upscaling like FSR.
Overclocking potential
A card like the ROG Strix with such a strong cooler of course wants to be overclocked. These plans are sweetened by a power limit which can be raised up to 122%. That ends up with 310W + 22% = 378W. However, this generous power limit couldn't be nearly exhausted in the entire test.

In order to overclock the GPU with an offset of 135MHz GPU Tweak III from ASUS was used. The latest version of GPU Tweak offers comfortable options to adjust the volt-frequency curve. With it the card ran at almost 2100MHz core clock in all scenarios.

Overclocking the GPU is almost always worthwhile and gives the user 4-5% more performance as expected considering an offset of 135MHz. These are moderate increases and you can hardly expect more nowadays because graphics cards already run relatively close to the limit ex-works. This is even more true for the ROG Strix RTX 3070 Ti. The card is very well optimized out of the box
Unfortunately, there is one drawback when overclocking the VRAM. The attempt to increase the memory clock speed from 1188 MHz (19 Gbps effective) to 1216 MHz (~19.5 Gbps effective) failed due to the fact that the performance reproducibly drops in Cyberpunk 2077. This is especially true for the percentiles. For this test a different scene with especially much streaming was used to stress the memory. Even more cautious overclocking attempts with less clock speed are practically pointless considering the small increase. However, the potential can vary from card to card and should therefore be explored by users themself.

In the following the most important telemetry data for OC vs. stock are listed. The clock speed could be sustained during the benchmarks on average. Power consumption and temperatures increase moderately. It's interesting that the maximum power limit of almost 380W isn't nearly exhausted in gaming workloads even with OC.

Conclusion
The ROG Strix RTX 3070 Ti from ASUS is abundantly equipped in every aspect: a massive cooler, the excellent power supply and the max power limit leave nothing to be desired. Whether the latter can actually be used sensibly at all is another question. The overclocking potential is good and is within the bounds of what one would expect from Nvidia's GA104-400. With the Q-BIOS temperatures are very good and even with OC the fan speed is realtively low which leads to a very pleasant operating noise overall.
The performance of the card at WQHD is very good and reserves are also available for higher resolutions. The ray tracing performance is convincing together with DLSS and is even faster than an RX 6800 XT which is of course not a direct competitor. ASUS lists an MSRP of 994 EUR for the card. If you are looking for a high-end card from Nvidia in a class of its own and are willing to invest more money you will make a good purchase going for the ROG Strix RTX 3070 Ti.
CapFrameX.com received the ROG Strix RTX 3070 Ti from ASUS as a permanent loan for testing. The manufacturer did not influence the review and there was no obligation to publish it. There was no NDA.