Why does my analysis show values that I’ve never seen while running the game?
As we explained in the previous blog post, the performance metrics get calculated using the raw frametime data converted to FPS.
This conversion into FPS has the side effect, that the values you get for the lower percentiles and min FPS may seem way too low compared to what you may have seen in an ingame FPS overlay. This is most noticable when using FPS limiters to cap your framerate at a fixed value, e.g. 120 FPS. While seeing a constant 120 FPS in your ingame overlay, analyzing the scene could give you a P1 of 110 FPS.
That's because all values are still calculated from the raw frametime values while the FPS you saw in your game are averaged values over a certain period of time. These 120 FPS, which would be a steady 8,33ms in frametimes, are never that steady. The frametimes usually vary around the target point, evenly going a bit higher and a bit lower, which makes the converted FPS values also vary between 110 and 130 FPS but in such a quick way that you'll always get 120 FPS on average every time your overlay refreshes.
In extreme cases with a relatively short benchmark, you could also get two or three frametime "spikes" up to 12ms that fall into the P0.1 range and while the overlay would percieve these spikes as an FPS drop from 120 to 119, the P0.1 metric could show you something like 83 FPS.
Here is an example made with the new filter option of CX (available in the next release version)
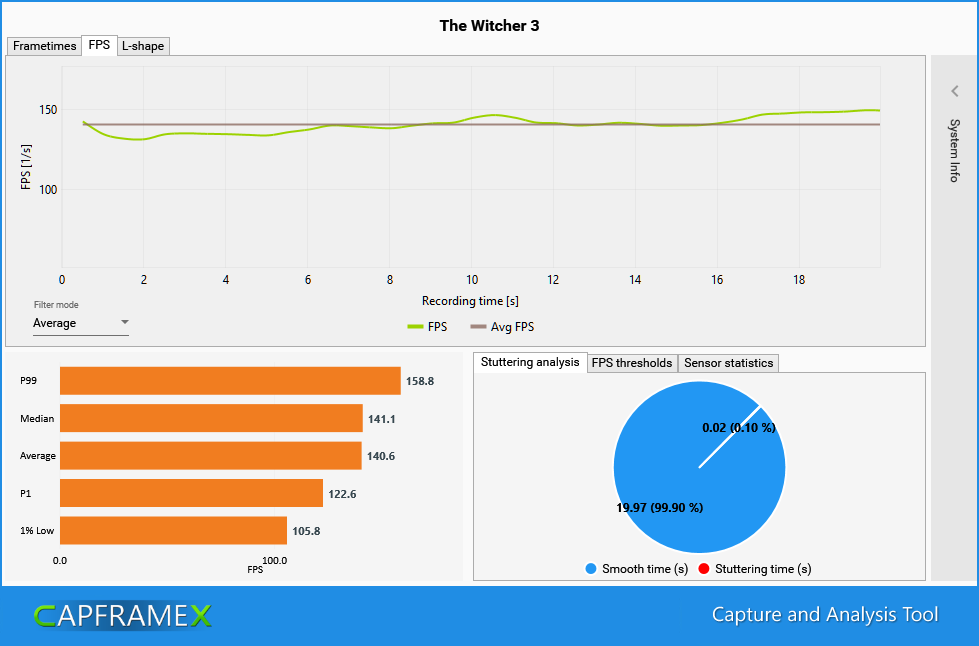
This filter does exactly what ingame overlays do, giving you an FPS value based on the average frametimes over the last polling period, making it easier to see the actual FPS trend, especially when comparing multiple records. The standard setting for this period is 500ms just like our standard overlay refresh period.
The lowest FPS value in this curve is 131, the highest is 149 and that is exactly what you would have seen constantly looking at the overlay while running the scene.
However we got a P99 of 158.8, a P1 of 122.6 and a 1% low of just 105.8 FPS.
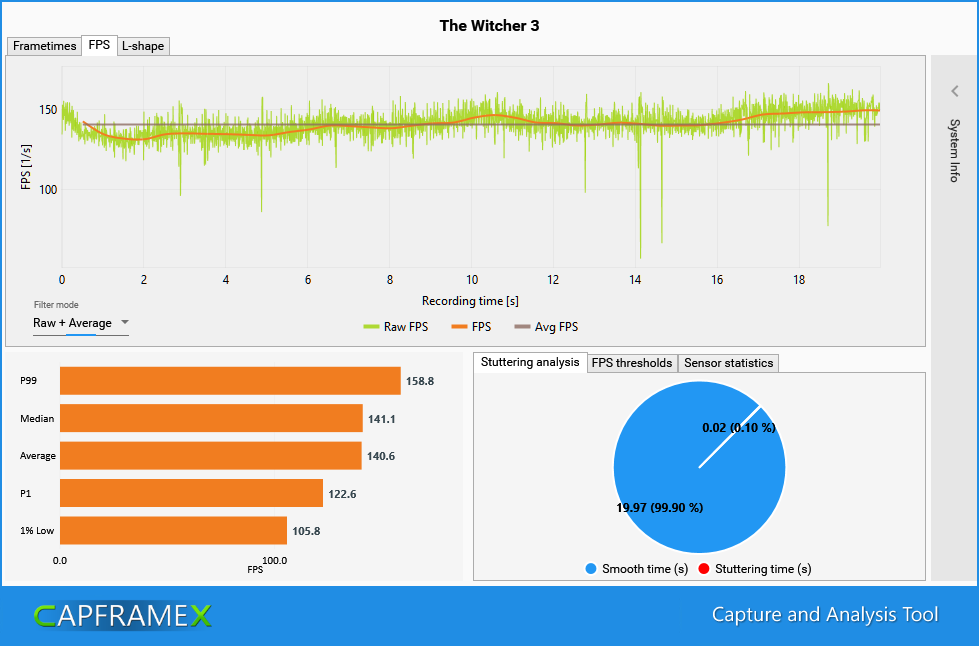
Why that is the case gets visible if we also show the raw FPS values behind the filtered FPS, showing every single frametime value converted to FPS.
The amount variance is different for every game, even when using FPS limiters. Here is a quick example of two different games capped at 60fps using the RTSS limiter. The first one is Red Alert in the OpenRA version, the second one is again Witcher 3.
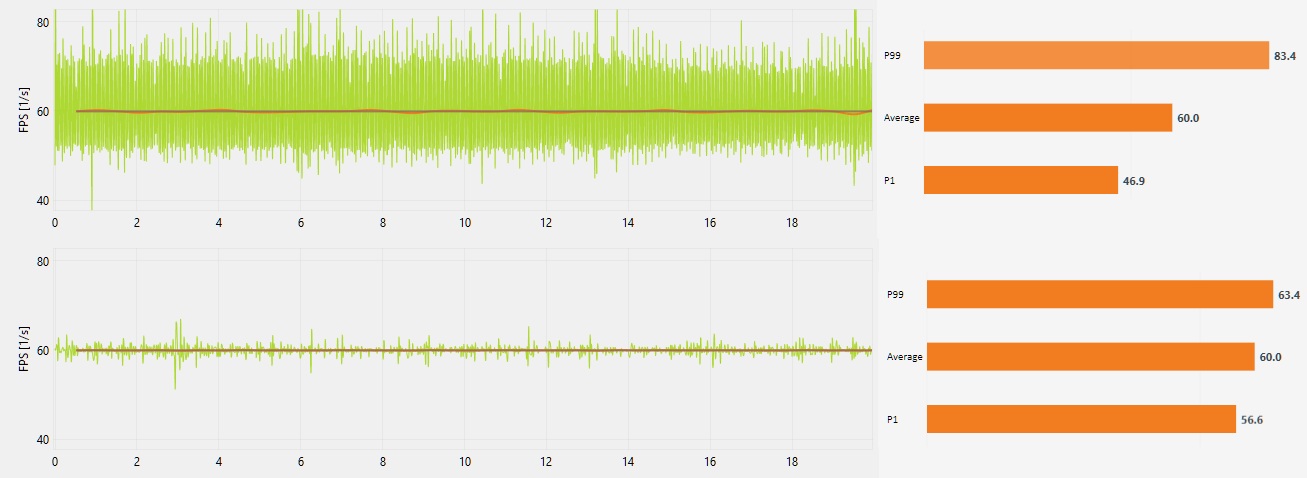
Even with the same game, the absolute variance gets bigger the higher your fps limit is set. That's because the variance of frametimes around the target framerate stays mostly the same but a target of 8ms with a variance between 7-9ms results in a bigger fps range than a target of 16ms with a variance between 15-17ms. (142.9-111.1 vs. 66.6-58.8 FPS)
Are these FPS values even realistic?
One could argue that these values are misleading because as the name “FPS” implies, it’s a value calculated over one second so a 1% percentile FPS value should also be a value that is the average result over one second instead of the converted frametime value of a single frame.
On the other hand, percentiles and x% low values are mainly used to spot frametime spikes so they have to be that precise.
Still, because they are calculated from the raw frametimes, it would be better to show them as frametimes instead of converting them, which would also turn a 1% low into a 1% high and a P1 into a P99.
The reason they are shown as converted fps values is mostly just to better blend in with the average fps bars. If they were shown as frametime values, you’d have an average fps bar for which a high value is good and a P99 frametime bar below it for which a high value is bad. Also pepole are just more used to FPS then they are to frametimes.
So while it isn’t the best way to show these performance metrics, it’s clearly the most understandable way and thus used by almost all reviewers and FPS benchmark tools.