But what if you consider part-load scenarios which occur for example when FPS limiters are used. This is undoubtedly a very practical scenario. Graphics cards from AMD and Nvidia can perform surprisingly differently here. We take a closer look at these things. For this test we used a new feature of CapFrameX for the first time which simulates the Total Board Power (W) of AMD graphics cards. We will show in a follow-up article that this approach works very well. However, for this project we need external support in the form of power consumption measurements with Nvidia's PCAT.

Methodology
Frametimes and sensor data were recorded using CapFrameX v1.6.6.
Configuration of CX
- Overlay refresh rate 1000ms
- Auto-disable OSD enabled
- Run History and Aggregation enabled
- Outlier tolerance 3%
- 3 valid runs with a duration of 20 seconds = 1 valid session
- Sensor logging enabled with a refresh rate of 500ms
- Default configuration of sensor logging for standard benchmarks + TGP Sim (AMD)
Game settings
- Resolutions: 1080p, 1440p
- Ultra or high settings to put stress on the graphics cards
Metrics
- Average FPS
- 1% percentile, which is not sensitive to reproducible and especially random outliers
Test System
An open test bench without further active cooling was used for the gaming benchmarks. The Gigabyte X570 AORUS MASTER was mounted horizontally on test bench. A be quiet! Dark Power Pro 650 watt power supply provided the components with power. The R9 5900X was cooled with the Noctua NH-D15 chromax.black. A PowerColor Red Devil Limited Edition Radeon RX 6800 XT and an ASUS ROG Strix RTX 3070 Ti were used for this test. The graphics cards were consistently operated stock.
Test Platform
CPU: AMD Ryzen 9 5900X
RAM: G.Skill 2x16 3200MT/s CL14-14-14-28 1T Gear Down Mode enabled
Mainbard: Gigabyte X570 AORUS MASTER
Some of the measurements were cross-checked with an RTX 3090 (stock). The boost behavior was very similar.
Boost Behavior 1080p and 1440p
The GPU core clock frequency and power consumption of the graphics cards were measured in 4 games.
- Doom Eternal
- Shadow of the Tomb Raider
- Battlefield V
- Strange Brigade (Vulkan)
These titles are characterized by high frame rates even at 1440p. The GPU utilization is already very high at 1080p.
Doom Eternal

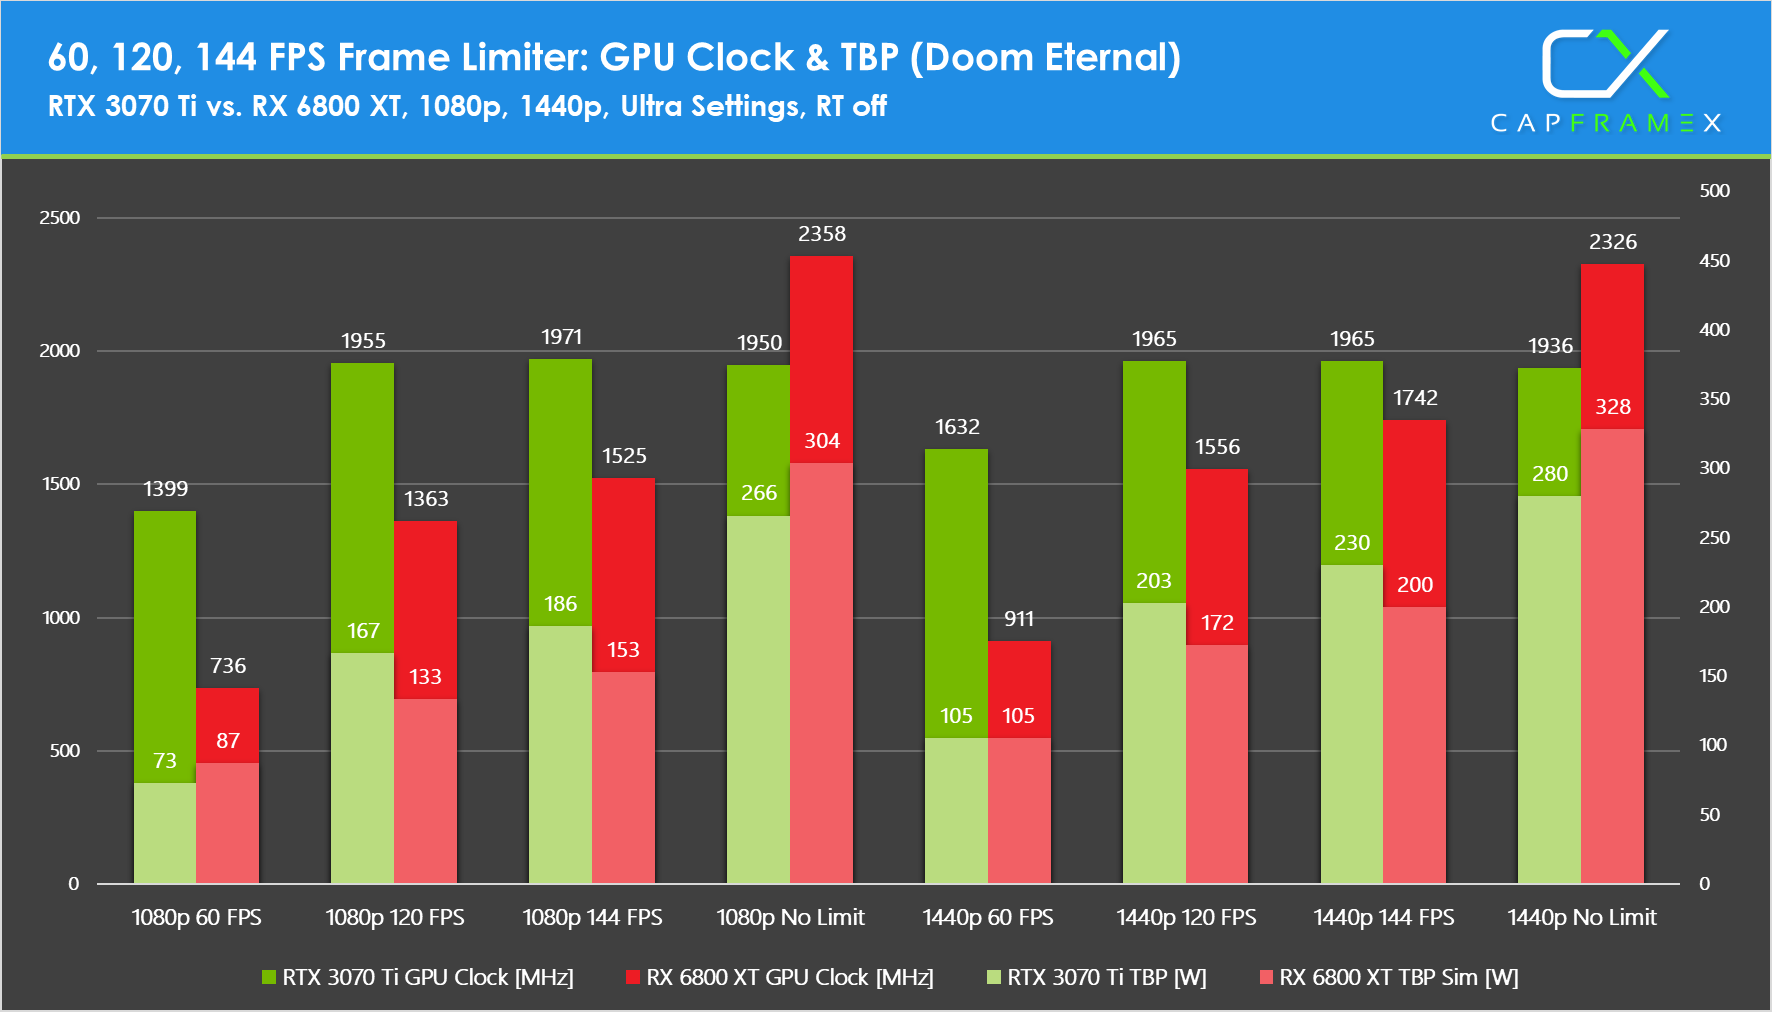
Using an FPS limiter the power consumption of the Nvidia card is significantly higher. An exception to this is the 1080p scenario with a 60 FPS limit. Although the GPU core clock of the RTX 3070 Ti is higher the power consumption is significantly lower. Without the limiter the AMD card needs more energy but the frame rates are also higher. The card converts energy into FPS.
Shadow of the Tomb Raider

At 1080p and with a 60 FPS limit a serious weakness of the Nvidia card's boost algorithm becomes apparent. The card boosts almost identically across all settings. As a result the RTX 3070 Ti's power consumption is much higher, saving potential isn't utilised.
Battlefield V

Measurements with Battlefield V alongside the other titles show that the boost algorithm acts wastefully. With 120 and 144 FPS limits the power consumption of the RTX 3070 Ti is clearly too high.
Strange Brigade (Vulkan)

The Strange Brigade results at 1080p doesn't even look that bad for the Nvidia card but this is no longer true turning towards the 1440p numbers. The boost algorithm shows significant optimization potential.
RTX 3090 with 60 FPS limit (Update 02/20/22)
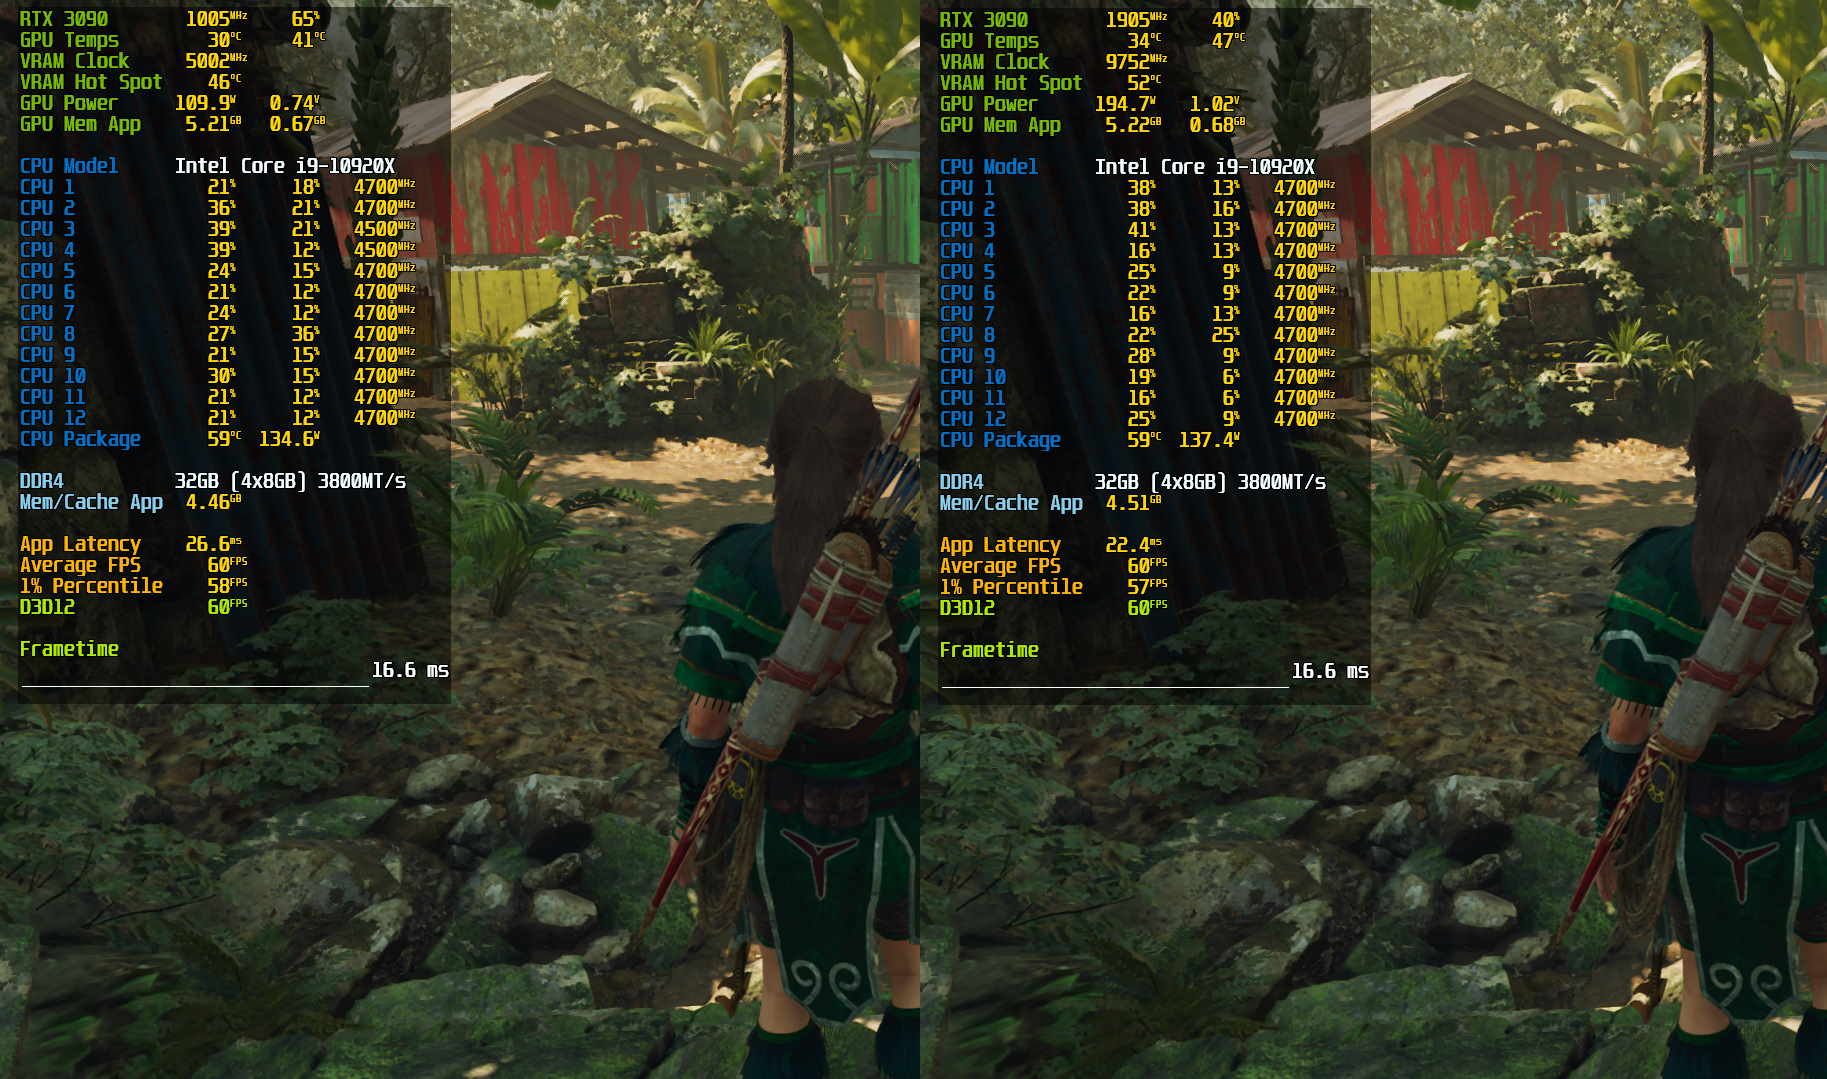
Since some users on Twitter criticized the choice of the graphics card for this test I would like to add another example using the RTX 3090 in Shadow of the Tomb Raider. The RTX 3070 Ti which uses GDDR6X is considered to be very inefficient. However, this article is not about the general efficiency of the chip, but about the boost behavior of the graphics card. On the right side of the comparison chart below you can see the sensor data of the RTX 3090 with stock settings. It strikes one that the core clock and voltage are maxed out, although the load at 1080p is relatively low. On the left, after manually adjusting the voltage/frequency curve, you can see how extremely wasteful the boost algorithm is. The power consumption drops from over 190W to about 110W. That's a difference of more than 40% and it's not even the maximum possible optimization potential. You can also reproduce this behavior with other members of the Ampere generation as ComputerBase e.g. showed some time ago.

Sometimes less is more
Generally, graphics cards from Nvidia and AMD are considered to be similarly efficient which is surprising considering AMD's manufacturing advantage (TSMC's 7nm process). However, a closer look reveals clear weaknesses for the competitor with the green logo. The boost algorithm does not work very smart, sometimes even wastefully, when the frame rates are limited which is done very often in practice. It is even recommended to do this to increase efficiency and improve frame times. Limiters break up local congestion in the render pipeline which can be helpful to get smoother frame times.
As mentioned at the beginning, particularly concise test scenarios were repeated with an RTX 3090. A very similar boost behavior was revealed. Nvidia should look at this and try to improve it. Until then, you can help yourself with tools like Afterburner and optimize the graphics card yourself.
