About a month ago, CD Projekt released a major update for Cyberpunk 2077. More details about patch 1.5 can be found on the official website. The update was of course reviewed by many users. It quickly turned out that more extensive ray tracing effects improved the image quality but also cost performance. There were also examples on YouTube that this was supposed to affect the CPU performance as well. This aroused my curiosity. In this small patch analysis we will look at two different scenes with proper CPU limitation.
The Sapphire Toxic RX 6900 XT Limited Edition used for this test was kindly provided by alza.de.

Methodology
Frame times and sensor data were captured using CapFrameX version v1.6.7.
Configuration of CX
- Overlay refresh rate 1000ms
- Auto-disable OSD enabled
- Run History and Aggregation active
- Outlier tolerance 3%
- 3 valid runs with a duration of 20 seconds = 1 valid session
- Sensor logging enabled with a refresh rate of 500ms
- Default configuration for sensor logging
Game settings
- Resolution: 720p
- High Preset, ray tracing off, DLSS/FSR off
Metrics
- Average FPS
- 1% + 0.2% percentile
Test Systems
An open test bench without further active cooling was used for the gaming benchmarks. A be quiet! Dark Power Pro 650 watt power supply provided the components with power. The i7-8700K was cooled with the Noctua NH-D15 chromax.black, while the i7-12700K ran in the productive system and was liquid-cooled. A Sapphire Toxic RX 6900 XT Limited Edition and an ASUS TUF Gaming GeForce RTX 3090 (liquid-cooled) were used for this test. The Radeon was overclocked (min GPU Core Clock) in order not to falsify the results by the graphics card's boost behavior.
Test Platform Intel + AMD
CPU: Intel Core i7-8700K 4.9GHz
GPU: RX 6900 XT OC
RAM: G.Skill 2x16 DDR4 3866MT/s CL16-16-16-32 1T
Mainbard: ASUS ROG Strix Z390-F Gaming
Test Platform Intel + Nvidia
CPU: Intel Core i7-12700K 5GHz
GPU: RTX 3090
RAM: G.Skill 2x16 DDR5 6200MT/s CL30-38-38-28 2T
Mainbard: ASUS ROG Maximus Z690 Hero
Benchmark Scene "Crowd"
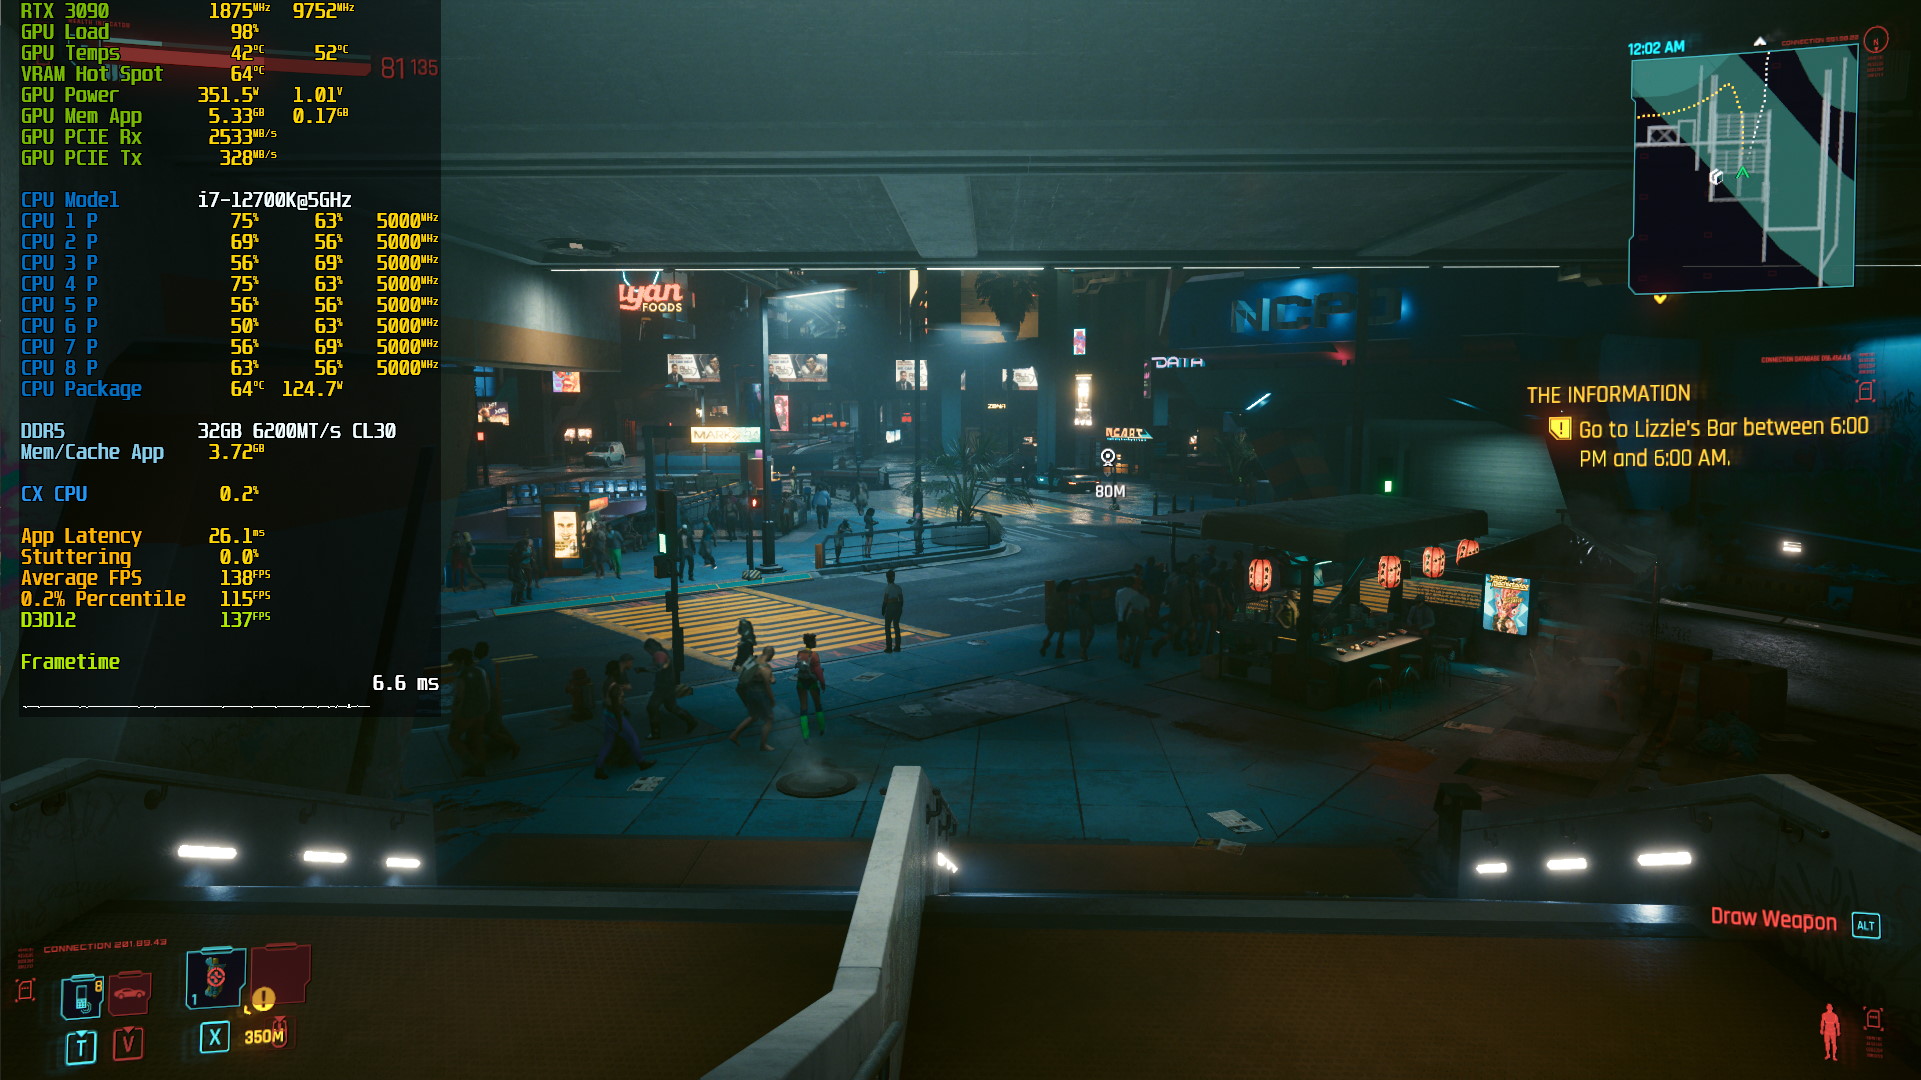
The first scene can be found relatively early in the game when entering Night City for the first time. The NPC density is high but of course it also depends on the settings you choose. For this test the maximum possible NPC density was used.

The screenshot above was taken with a resolution of 1080p. According to the overlay the GPU load is already 98%. So you have to reduce the resolution to get a proper CPU limitation. Otherwise, no reliable statements about the CPU performance can be made.

Contrary to expectations, the CPU performance increased significantly. The Alder Lake CPU gains about 11% with patch 1.5 and the i7-8700K even almost 14%.
Benchmark Scene "On the Road"
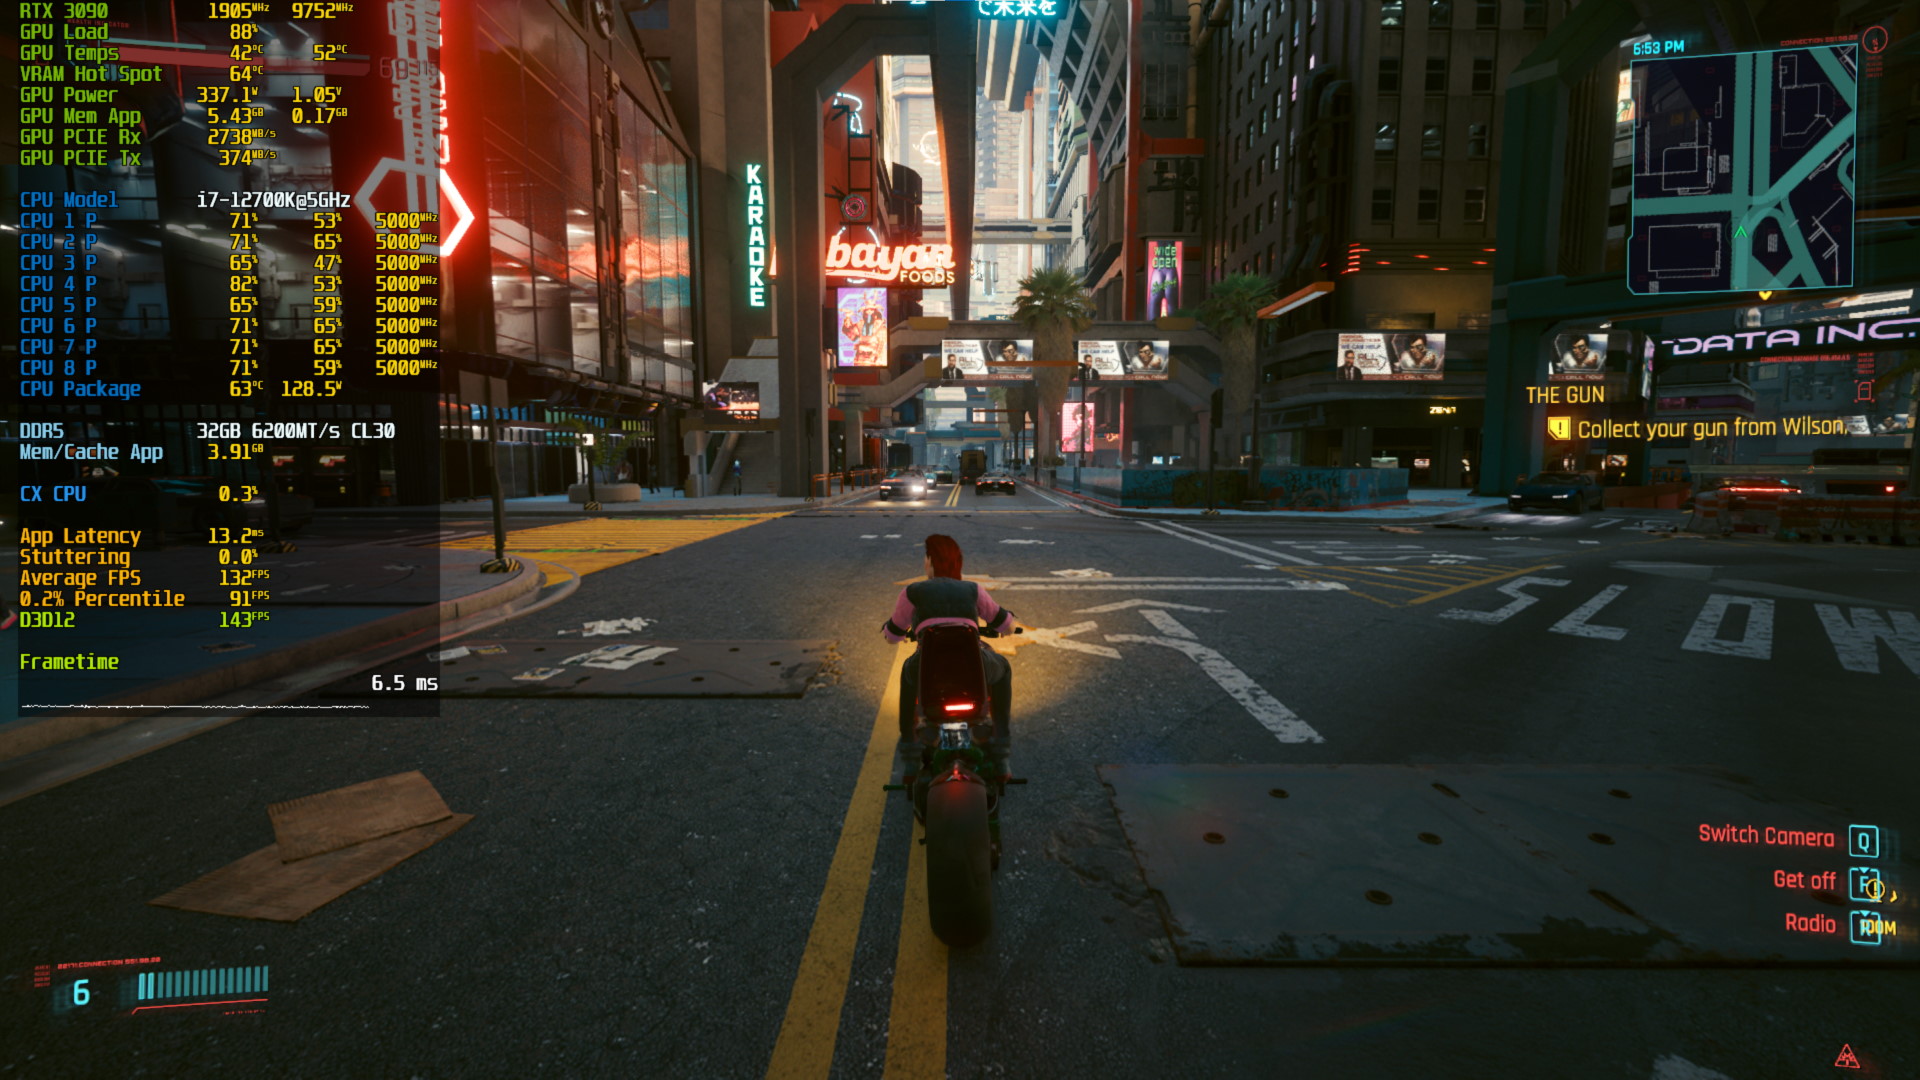
The second scene covers a larger area in Night City which is crossed by motorcycle. The scene is characterized by heavy streaming which incidentally makes this particular benchmark a very good test to check the stability of VRAM OC.

Overall, this scene is more demanding for the CPU which is also reflected by the GPU usage. Theoretically, there is no need to reduce the resolution further but this is done anyway for consistency.

Interestingly, patch 1.5 causes a less large performance jump related to this scene. The tuned i7-12700K gains 5% and the also overclocked i7-8700K only about 2.4%.
Patch 1.5 good for CPU performance?
This question can clearly be answered with "yes". The performance improvement obviously depends heavily on the scene but almost 14% more FPS related to the first scene together with the Coffee Lake CPU is accepted and appreciated.
The so-called performance drops observed by some users on YouTube due to the extensive update could not be confirmed, at least in terms of CPU performance. We wish you a pleasant ride through Night City.
