Content of the article: gaming benchmarks Alder Lake-S without GPU limitation, demanding and real in-game scenes, IPC comparisons with other archs, application benchmarks, efficiency, power consumption, gaming performance DDR5.
The time has come: Intel's 12th generation is officially available as of today and only about seven months after Rocket Lake was launched. Or should we say fortunately just seven months? The 11th generation did not fare well in reviews, was inefficient due to the old 14nm process and the amount of cores was also a scarce good. But does Alder Lake make things better now? The i9 and i7 models also have only 8 so-called Performance Cores (Golden Cove) but there is the matter of the hybrid approach which Intel calls big.LITTLE. For example, the i9-12900K/KF has additional 8 Efficient Cores (Gracemont), which should improve the multithreaded performance significantly.
Alder Lake-S entails some innovations and one of them is a new manufacturing process, which Intel recently calls Intel 7. Behind the marketing name it's still a 10nm process but optimized which is called Enhanced SuperFin. 10nm has been a long time coming, at least in terms of mass production. But not only that, Intel increases the IPC significantly and pioneers a new memory and PCIe standard: Alder Lake supports DDR5 and PCIe Gen 5. However, the memory controller can still be operated together with DDR4. Compatible boards are available in stores starting today.
This review is focused on gaming performance of the 12th generation, but there are also some basic application benchmarks. The big questions of what improvements the new architecture can offer in terms of gaming workloads and whether DDR5 ultimately even has a positive impact on gaming performance is going to be answered in detail.
Is Alder Lake a good gaming architecture?
The architecture of a CPU is incredibly multi-faceted and complex. How important individual properties are also depends on the respective workload. Gaming workloads tend)to be characterized by the fact that small data units often have to be fetched and processed. This circumstance therefore makes gaming workloads (tend to be) latency-heavy. Furthermore, the threading is usually designed in such a way that worker threads have to be synchronized to the main thread at the end, which then benefits from a high single-thread performance. The following die shot (probably schematic, not physically correct) shows the most important units of the Alder Lake CPU. The Performance Cores are connected via a ring bus, the two Efficiency Core clusters are also connected via the ring bus. The iGPU units are on the right and the memory controller is on the left of the core area, which is connected to the Last Level Cache (LLC) via the ring bus. At least that is what latency tests indicate.
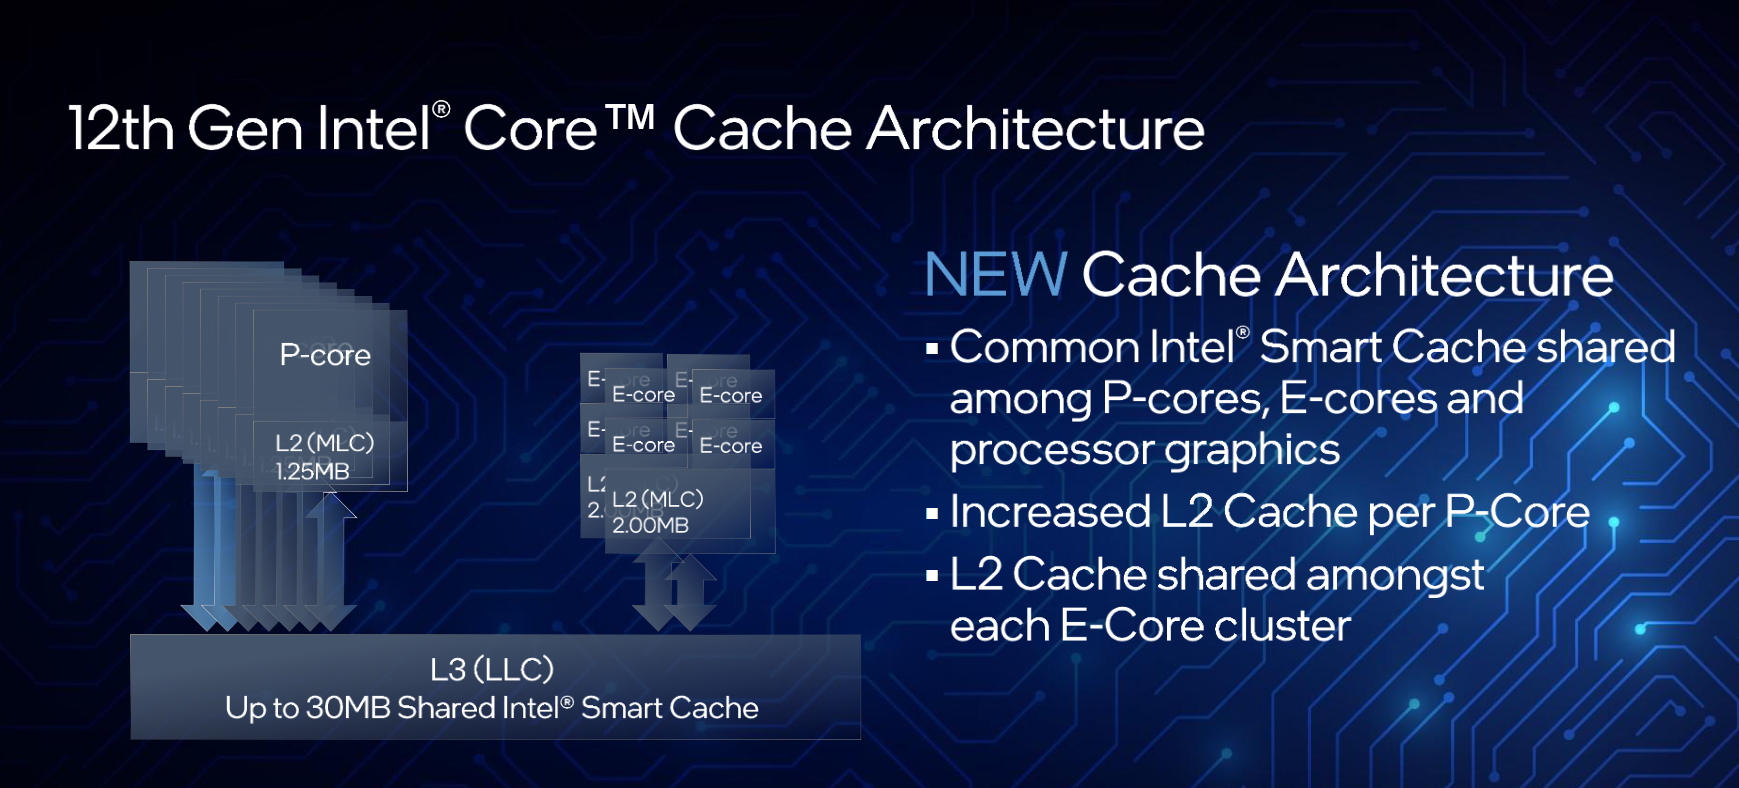
The critical components and features for gaming performance are therefore essentially caches, memory system and single-thread performance, whereby more modern titles can also benefit from 16 threads. Beyond an 8-core CPU with SMT, no further scaling can usually be determined in practice so 6-8 cores are considered optimal. The i9-12900K for example has 30MB of L3 cache. The question now is whether a thread can access the entire cache without various penalty latencies. As the following chart illustrates, this is indeed the case, which has a positive impact on gaming performance.
Thus, the top model has a similar amount of cache like an R7 5800X, which has 32MB total. The larger Ryzen 5000 models with 2 CCDs have twice as much L3 cache with 64MB. However, this cannot be used globally related to a single thread without having to perform expensive remote accesses to the neighboring CCD.
Memory System and Inter-core Latencies
The large L3 cache is an important requirement for good gaming performance, but that alone is not enough. The cache must have good access latencies and the same applies to the system memory. The memory latencies are measured with AIDA64 Extreme and with an OpenSource solution, which offers a significantly higher test depth of 1GB. AIDA64 has recently faced some criticism from reputable reviewers regarding its consistency and implemented methodology. In essence, the criticism is that the values are too low, which is most likely due to the fact that the test depth is set too low. Testing with the "Full Random" method (can be customized with right click) suggests that the test depth is 64MB. This becomes more critical the larger the LLC of the CPU being tested. The AIDA64 benchmark results are nevertheless published additionally, since the tool is very well known and a certain comparability with existing measurements is given. There is no reason to do without this additional information.
The interesting values refer to the DDR5 performance. As expected, the bandwidth increases significantly from ~50GB/s up to ~82GB/s (read), but unfortunately so does the memory latency. Lower values are better. AIDA64 measures ~58ns with DDR4 and DDR5 is about 70ns. Additionally, it should be mentioned that DDR5-5400 does not meet the specification. The latency would increase further with DDR5-4400.
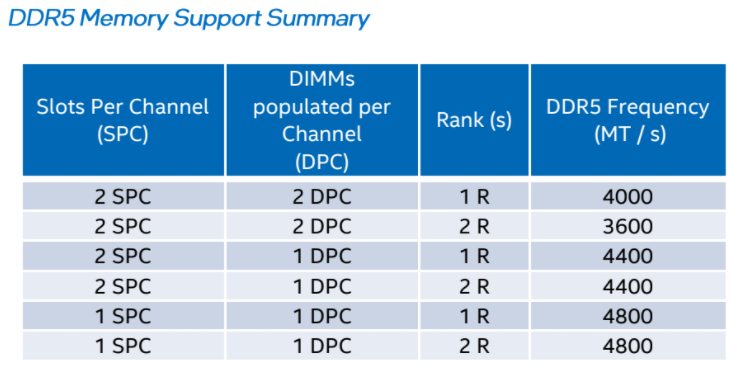 Memory support depending on DIMMs per channel and rank (Source: Intel)

The above-mentioned open source tool can be used to examine the latencies more closely. Since the thread used by the benchmark tool can be pinned to any core it is possible to measure the access latency of the Effiecient Cores specifically. Already from a test depth of 32KB, clear differences show in comparison with the execution of the test on the P cores. In direct comparison with the data of the i9-11900K, you can see the effects of the larger L2 cache (1.25MB Golden Cove vs. 512KB Cypress Cove). Starting at a test depth of 16MB, the curve rises much faster for the i9-11900K, as the i9-12900K can access a total of 30MB of L3 cache. Looking at the maximum test depth of 1GB, we can see big differences between DDR4 (72ns) and DDR5 (90ns). It is now interesting to examine whether this relatively large difference has a negative impact on gaming performance.
The following table lists all latencies (ns) of the tested CPUs in detail. Particularly interesting are the latencies of the Ryzen 5900X, which were measured once with Windows 11 L3 Cache Fix and once without. The differences are considerable starting from a test depth of 2MB.
Memory system latencies (ns)
| Testtiefe (KB) | 12900K (default) DDR4-3200 | 12900K (E Cores) DDR4-3200 | 12900K (default) DDR5-5400 | 12600K (default) DDR4-3200 | 11900K DDR4-3200 | 10900K DDR4-3200 | 5900X (mit L3 Fix) DDR4-3200 | 5900X (ohne L3 Fix) DDR4-3200 | 3950X (mit L3 Fix) DDR4-3200 |
|---|---|---|---|---|---|---|---|---|---|
| 2 | 0.98 | 1.03 | 0.96 | 1.08 | 0.95 | 1.02 | 1.02 | 1.03 | 1.12 |
| 4 | 0.97 | 1.03 | 0.96 | 1.09 | 0.95 | 0.98 | 1.02 | 1.02 | 1.10 |
| 8 | 0.97 | 1.03 | 0.96 | 1.06 | 0.95 | 0.96 | 1.02 | 1.02 | 1.10 |
| 12 | 0.97 | 1.03 | 0.96 | 1.05 | 0.95 | 0.99 | 1.02 | 1.02 | 1.10 |
| 16 | 0.97 | 1.03 | 0.96 | 1.05 | 0.95 | 0.99 | 1.02 | 1.02 | 1.07 |
| 24 | 0.97 | 1.03 | 0.96 | 1.06 | 0.95 | 0.95 | 1.02 | 1.02 | 1.07 |
| 32 | 0.97 | 1.04 | 0.97 | 1.06 | 0.95 | 0.96 | 1.04 | 1.04 | 1.07 |
| 48 | 0.98 | 2.56 | 0.97 | 1.08 | 0.95 | 1.42 | 1.59 | 1.60 | 1.72 |
| 64 | 1.50 | 3.30 | 1.49 | 1.61 | 1.36 | 1.65 | 1.86 | 1.91 | 2.11 |
| 96 | 2.01 | 4.02 | 1.98 | 2.17 | 1.74 | 1.86 | 2.12 | 2.14 | 2.35 |
| 128 | 2.25 | 4.34 | 2.21 | 2.39 | 1.92 | 1.98 | 2.25 | 2.26 | 2.48 |
| 192 | 2.48 | 4.72 | 2.44 | 2.59 | 2.10 | 2.09 | 2.39 | 2.40 | 2.63 |
| 256 | 2.60 | 5.47 | 2.55 | 2.74 | 2.19 | 2.29 | 2.47 | 2.59 | 2.71 |
| 512 | 3.12 | 6.58 | 3.06 | 3.30 | 3.04 | 6.88 | 4.83 | 4.36 | 3.54 |
| 600 | 3.31 | 6.76 | 3.24 | 3.45 | 4.22 | 7.83 | 5.10 | 5.09 | 4.48 |
| 768 | 3.53 | 6.96 | 3.46 | 3.67 | 5.69 | 8.65 | 6.20 | 6.21 | 5.70 |
| 1024 | 3.74 | 7.15 | 3.69 | 3.93 | 6.99 | 9.30 | 6.55 | 6.60 | 6.77 |
| 1536 | 5.62 | 7.33 | 5.47 | 5.96 | 8.28 | 10.21 | 8.13 | 8.15 | 7.42 |
| 2048 | 7.67 | 7.63 | 7.53 | 8.21 | 8.91 | 10.30 | 8.92 | 9.94 | 7.88 |
| 3072 | 9.63 | 12.02 | 9.17 | 10.02 | 9.52 | 10.66 | 9.73 | 21.15 | 8.84 |
| 4096 | 10.60 | 14.23 | 9.99 | 10.99 | 9.87 | 10.83 | 10.15 | 13.25 | 9.12 |
| 5120 | 11.30 | 15.50 | 10.60 | 11.10 | 10.10 | 11.00 | 10.50 | 21.10 | 9.30 |
| 6144 | 11.70 | 16.40 | 10.80 | 11.60 | 10.20 | 11.20 | 10.60 | 44.40 | 9.40 |
| 8192 | 12.70 | 17.50 | 11.50 | 13.00 | 10.90 | 12.20 | 10.80 | 54.30 | 9.50 |
| 10240 | 13.40 | 19.60 | 12.40 | 13.30 | 11.40 | 12.80 | 11.00 | 46.70 | 9.60 |
| 12288 | 14.00 | 21.00 | 13.50 | 14.50 | 11.80 | 13.70 | 11.10 | 50.90 | 9.60 |
| 16384 | 15.40 | 22.60 | 14.60 | 18.10 | 16.80 | 15.60 | 11.20 | 49.80 | 12.20 |
| 24567 | 17.90 | 26.80 | 20.30 | 32.50 | 29.50 | 24.30 | 11.50 | 52.10 | 33.90 |
| 32768 | 26.00 | 33.10 | 29.60 | 37.70 | 37.20 | 33.00 | 15.50 | 59.20 | 44.40 |
| 65536 | 45.90 | 58.30 | 55.80 | 55.30 | 49.00 | 48.10 | 48.80 | 66.70 | 64.70 |
| 98304 | 53.70 | 68.00 | 66.50 | 59.40 | 53.10 | 53.30 | 60.90 | 72.50 | 70.90 |
| 131072 | 57.60 | 73.40 | 73.80 | 62.20 | 55.50 | 56.30 | 67.70 | 72.40 | 74.00 |
| 262144 | 66.00 | 84.00 | 81.00 | 69.00 | 60.00 | 60.00 | 78.00 | 81.00 | 81.00 |
| 393216 | 66.00 | 84.00 | 81.00 | 72.00 | 60.00 | 63.00 | 81.00 | 84.00 | 84.00 |
| 524288 | 69.00 | 87.00 | 84.00 | 72.00 | 63.00 | 63.00 | 87.00 | 87.00 | 87.00 |
| 1048576 | 72.00 | 87.00 | 90.00 | 75.00 | 63.00 | 63.00 | 90.00 | 96.00 | 87.00 |
The intercore latencies are measured with MicroBenchX (version 1.0.4). The latency heatmaps can be rendered comfortably with the Generator on our website.
The latency matrix reveals some interesting details about the CPU's interconnect topology. A total of 5 cases can be derived.
- Intra-core latency P cores: 4.5ns
- Inter-core latency P to P cores: ~25-30ns
- Inter-core latency P to E Cores: ~32-40ns
- Inter-core latency E cluster to E cluster: ~38-43ns
- Intra-core latency E Cluster: ~47-53ns
As soon as an E Core is involved in the intercore communication, the latencies increase significantly. Interestingly, the latency is highest within an E Core cluster.

We can only speculate about the circumstances. An E Core cluster has a 2MB L2 cache, which is shared by all cores. The L2 cache is connected to the LLC via the IDI (Intra-Die Interconnect). In the diagram you can see that the geometric distance is relatively large, moreover the shared cache could cause a higher management overhead. However, based on the theory, the communication paths
- E Core cluster A → L2(IDI) → LLC → L2(IDI) → E Core cluster B and
- E Core A → L2(IDI) → LLC → L2(IDI) → E-Core B
should be equivalent. An inquiry has already been made to Intel with a request for a more detailed explanation.
Methodology
Frametimes were captured with CapFrameX in version v1.6.6, which implements telemetry support and Performance/Efficient Core detection for Alder Lake.
Configuration of CX
- Overlay refresh rate 1000ms
- Auto-disable OSD active
- Run History and Aggregation enabled
- Outlier tolerance 3%
- 3 valid runs with a duration of 20 seconds = 1 valid session
- Sensor logging enabled with a refresh rate of 500ms
- Default configuration of sensor logging for standard benchmarks
Game settings
- Resolutions: 720p, 1080p
- Render scaling reduction if needed (does not apply to 1080p).
- Reduced AA/AF/AO to a minimum
- Post Processing disabled
- All other settings maximized to maximize draw calls
Overall, demanding custom scenes were used to maximize stress on CPUs and memory.
Metrics
- Average FPS
- 1% percentile, which is not sensitive to reproducible and especially random outliers.
Operating System
- Only Windows 11 has been used for the entire test. A follow-up article with a Windows 10 vs. 11 comparison is already planned.
- AMD Ryzen CPUs have been tested with the so-called Windows 11 L3 fix.
- Virtualization was disabled in the BIOS to ensure maximum gaming performance.
Power configuration of the CPUs
- All Intel CPUs were configured via "Enforce all limits" in the BIOS.
- The i9-12900K has additionally been tested with PL1=125W in applications.
- The Processor Base Power of 241W has no practical impact on gaming performance. Consumption in gaming workloads is always significantly lower. There will be a follow up article contrasting performance with PL1=125 watts.
- All Ryzen CPUs ran with Auto Settings.
- The i9-10980XE ran as a showcase with a power limit of 500 watts.
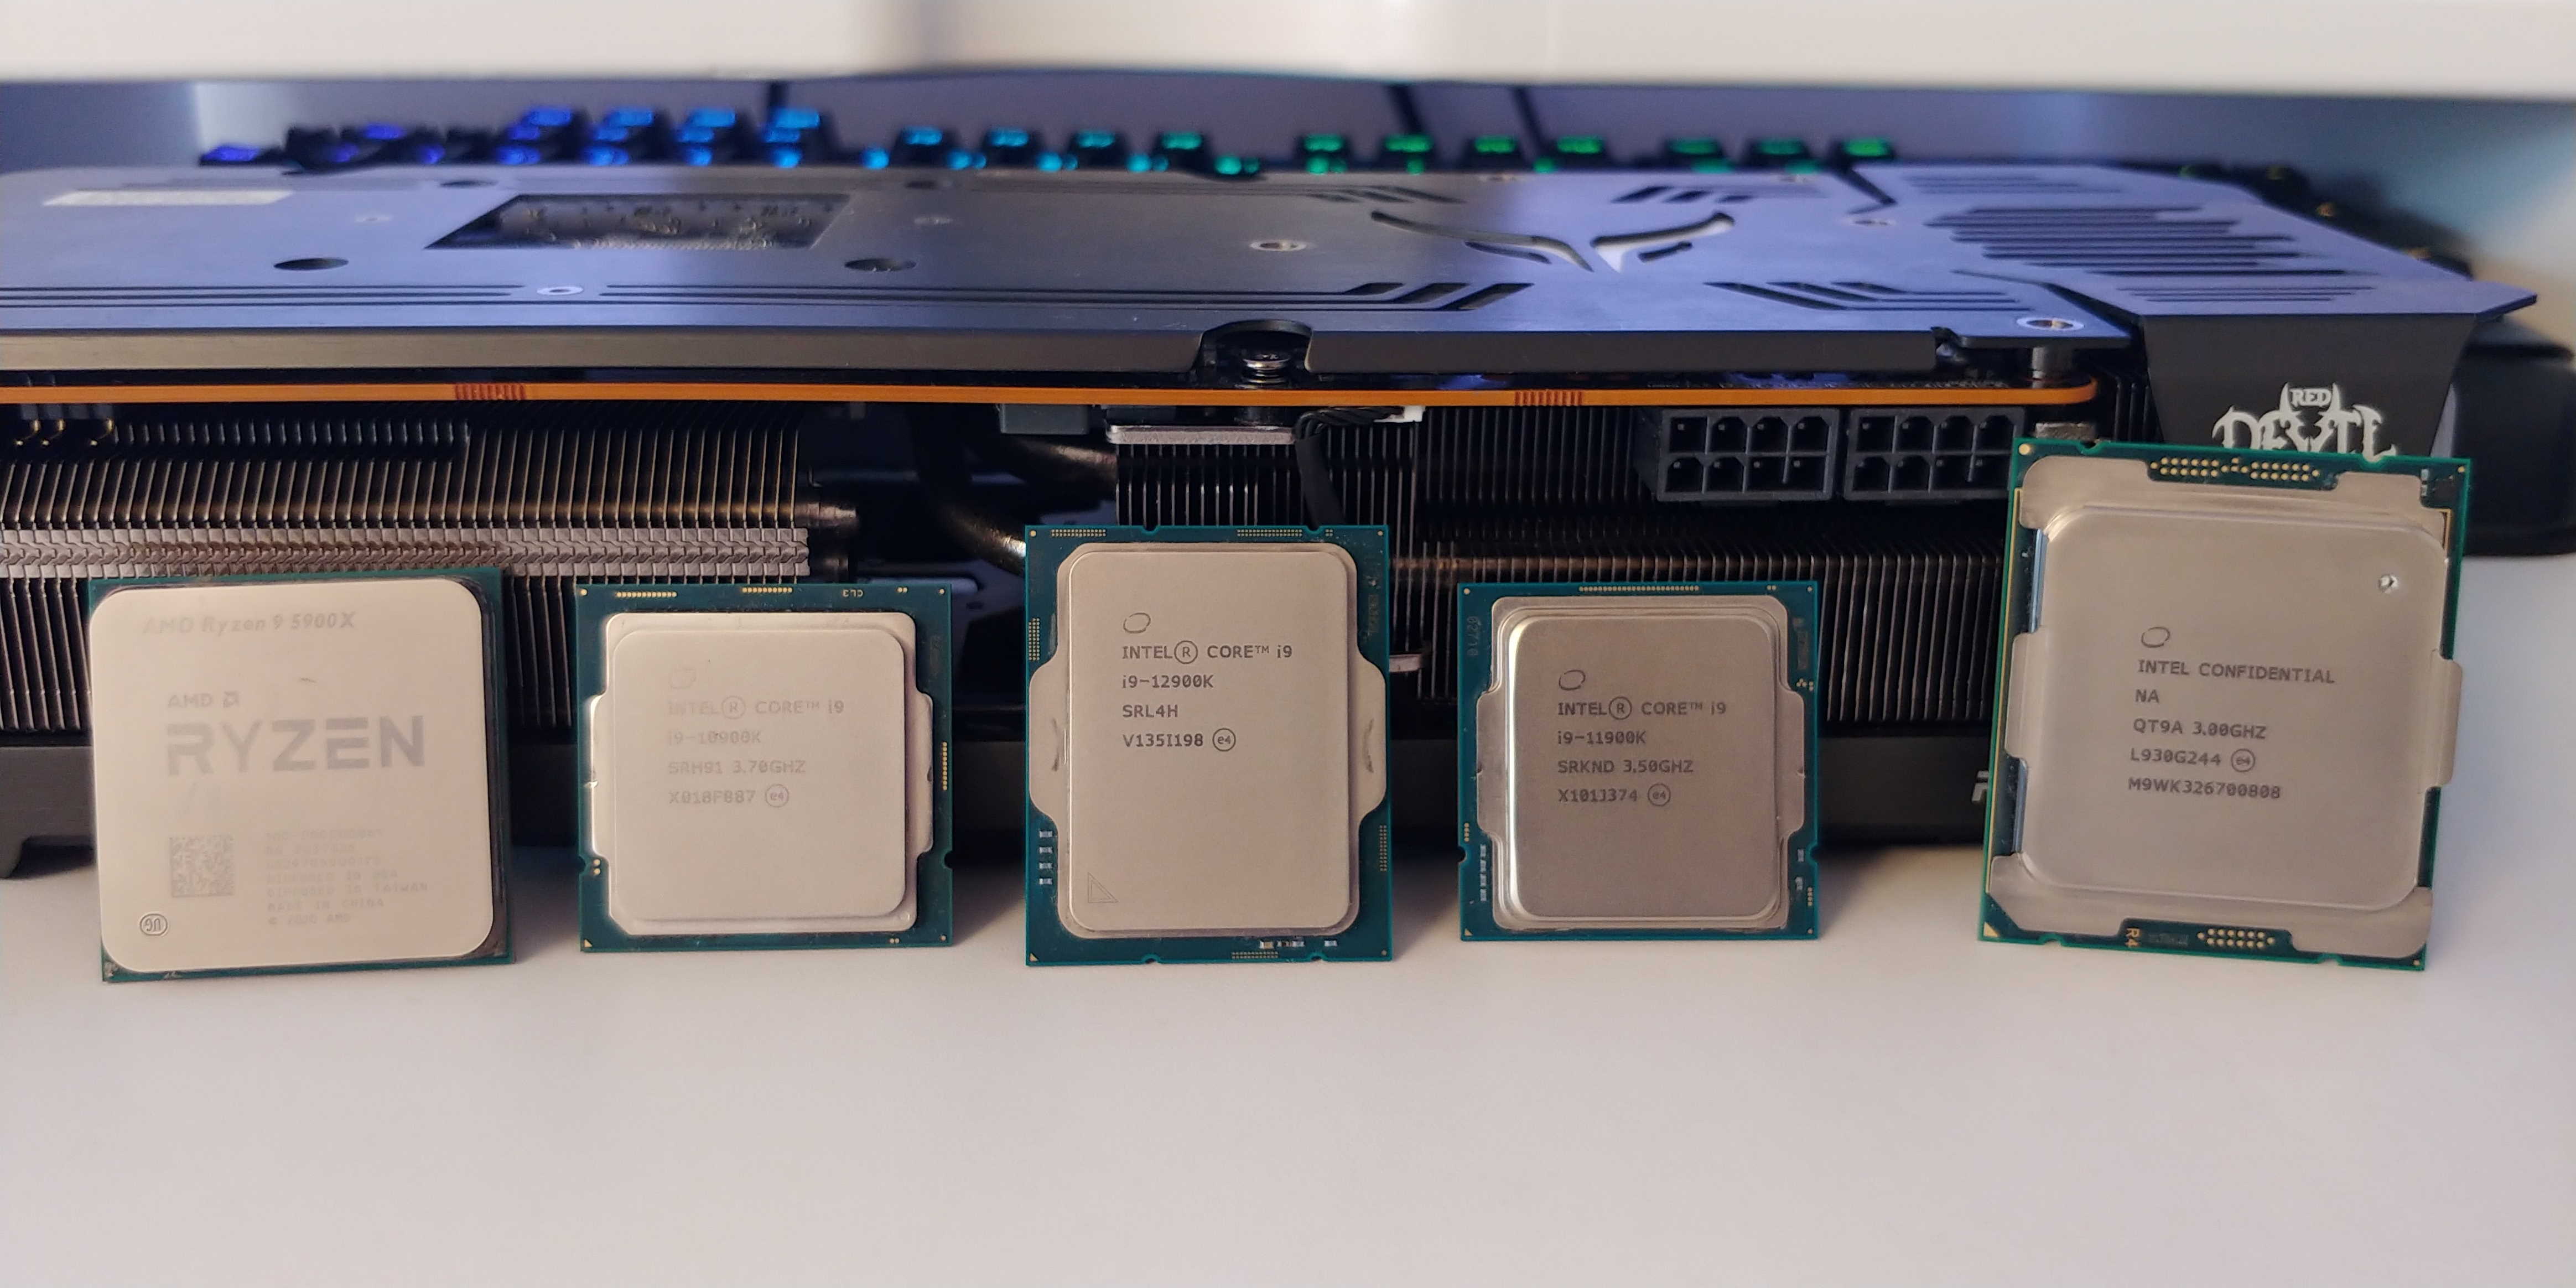
Test Systems
An open test bench without further active cooling was used for the gaming benchmarks. The board is mounted horizontally on the test bench. A be quiet! Dark Power Pro 650 watt power supply provided the components with power. The CPUs were cooled with the Noctua NH-D15 chromax.black. On the Z690 boards, the NH-D15 was mounted to the socket with an LGA1700 mounting upgrade kit. An exception to this was the i9-10980XE which was water cooled. 2x16GB DDR4 G.Skill F4-4266C17D-32GVKB and 2x16GB DDR5 Kingston KF552C40BBK2-32 were used as RAM. The graphics output was handled by a PowerColor Red Devil Limited Edition AMD Radeon RX 6800 XT, which was overclocked to 2500/2100MHz.
| CPU | Graphics Card | Mainboard | Memory | Cooling |
|---|---|---|---|---|
| i9-12900K | RX 6800 XT OC | ASUS ROG MAXIMUS Z690 HERO | 2x16GB DDR5-5400 CL40-40-40-80 2T | Noctua NH-D15 chromax.black |
| i9-12900K | RX 6800 XT OC | ASUS ROG STRIX Z690-A GAMING WIFI D4 | 2x16GB DDR4-3200 CL16-16-16-36 1T | Noctua NH-D15 chromax.black |
| i9-12900K | RX 6800 XT OC | ASUS ROG STRIX Z690-A GAMING WIFI D4 | 2x16GB DDR4-3700 CL16-16-16-36 2T | Noctua NH-D15 chromax.black |
| i5-12600K | RX 6800 XT OC | ASUS ROG STRIX Z690-A GAMING WIFI D4 | 2x16GB DDR4-3200 CL16-16-16-36 1T | Noctua NH-D15 chromax.black |
| i9-11900K | RX 6800 XT OC | ASUS ROG Z590 MAXIMUS XIII APEX | 2x16GB DDR4-3200 CL16-16-16-36 1T | Noctua NH-D15 chromax.black |
| i9-10980XE OC | RTX 3090 Default | ASUS ROG X299 RAMPAGE VI EXTREME OMEGA | 4x8GB DDR4-3733 CL15-15-15-30 1T | Heatkiller IV Pro + MO-RA 420 Pro |
| i9-10900K | RX 6800 XT OC | ASUS ROG Z590 MAXIMUS XIII APEX | 2x16GB DDR4-3200 CL16-16-16-36 1T | Noctua NH-D15 chromax.black |
| R9 5900X | RX 6800 XT OC | Gigabyte X570 AORUS MASTER | 2x16GB DDR4-3200 CL16-16-16-36 1T | Noctua NH-D15 chromax.black |
| R9 3950X | RX 6800 XT OC | Gigabyte X570 AORUS MASTER | 2x16GB DDR4-3200 CL16-16-16-36 1T | Noctua NH-D15 chromax.black |
Mainboards (DDR4 and DDR5)
ASUS kindly provided us with the ROG STRIX Z690-A GAMING WIFI D4 (DDR4) and the ROG MAXIMUS Z690 HERO (DDR5) for these tests. The application benchmarks were partly performed with BIOS version 0604 and partly retested with version 0702. All gaming benchmarks were repeated with version 0702, which was very time-consuming. Cyberpunk 2077 for example ran up to 6% faster with the newer version and it became apparent during retesting that this was not an isolated case.
IPC
The IPC was determined with MicroBenchX v1.0.4. All CPUs were operated with a fixed clock of 4 GHz. AVX offsets were disabled in the BIOS. The priority was set to "High" in the Task Manager.
| IPC | R9 5900X 4GHz | i9-10900K 4GHz | i9-11900K 4GHz | i9-12900K 4GHz | |||||
|---|---|---|---|---|---|---|---|---|---|
| Step | Test | Time[s] | IPC | Time[s] | IPC | Time[s] | IPC | Time[s] | IPC |
| 1/36 | Add AVX256 Float | 8.01 | 2.25 | 8.01 | 2.25 | 8.01 | 2.25 | 8.02 | 2.25 |
| 2/36 | Add AVX256 Integer | 4 | 4.5 | 5.34 | 3.37 | 5.34 | 3.37 | 5.34 | 3.37 |
| 3/36 | Add AVX512 Float | not supported | not supported | 16 | 1.12 | 8.08 | 2.23 | ||
| 4/36 | Add AVX512 Integer | not supported | not supported | 8.01 | 2.25 | 8.02 | 2.25 | ||
| 5/36 | Add Integer 64 | 3.5 | 4.28 | 3.5 | 4.28 | 3.51 | 4.28 | 2.85 | 5.26 |
| 6/36 | Add SSE128 Float | 8.01 | 2.25 | 8 | 2.25 | 8.02 | 2.25 | 8 | 2.25 |
| 7/36 | Add SSE128 Integer | 4.01 | 4.49 | 5.34 | 3.37 | 5.34 | 3.37 | 5.34 | 3.37 |
| 8/36 | And Integer 64 | 4 | 3.75 | 3.5 | 4.28 | 3.5 | 4.28 | 2.85 | 5.27 |
| 9/36 | Div AVX256 Float | 2.8 | 0.32 | 4 | 0.22 | 4 | 0.22 | 4 | 0.22 |
| 10/36 | Div AVX512 Float | not supported | not supported | 8.01 | 0.11 | 8 | 0.11 | ||
| 11/36 | Div Integer 64 | 3.85 | 0.17 | 11.5 | 0.06 | 5.5 | 0.12 | 5.51 | 0.12 |
| 12/36 | Div SSE128 Float | 2.74 | 0.33 | 2.4 | 0.37 | 2.4 | 0.37 | 2.4 | 0.37 |
| 13/36 | Mix Integer Float | 1.29 | 5.03 | 1.94 | 3.35 | 1.75 | 3.71 | 1.33 | 4.88 |
| 14/36 | Madd AVX256 Float | 2 | 2.25 | 2 | 2.25 | 2 | 2.25 | 2.01 | 2.24 |
| 15/36 | Madd SSE128 Float | 2 | 2.25 | 2 | 2.25 | 2 | 2.25 | 2 | 2.25 |
| 16/36 | Copy Integer 64 | 2.33 | 6 | 3.25 | 4.31 | 3 | 4.66 | 2.2 | 6.36 |
| 17/36 | Copy Dep Integer 64 | 3 | 5 | 10.2 | 1.47 | 3 | 5 | 2.39 | 6.27 |
| 18/36 | Copy Self Integer 64 | 2.5 | 6 | 3.5 | 4.28 | 3.5 | 4.28 | 2.85 | 5.27 |
| 19/36 | Mul AVX256 Float | 2 | 2.25 | 2 | 2.25 | 2 | 2.25 | 2 | 2.25 |
| 20/36 | Mul AVX256 Integer | 2 | 2.25 | 4 | 1.12 | 4.17 | 1.08 | 4.06 | 1.11 |
| 21/36 | Mul AVX512 Float | not supported | not supported | 4 | 1.12 | 4 | 1.12 | ||
| 22/36 | Mul AVX512 Integer | not supported | not supported | 8.01 | 0.56 | 8 | 0.56 | ||
| 23/36 | Mul Integer 64 | 3.25 | 1.15 | 3.25 | 1.15 | 3.25 | 1.15 | 3.26 | 1.15 |
| 24/36 | Mul SSE128 Float | 2 | 2.25 | 2 | 2.25 | 2 | 2.25 | 2 | 2.25 |
| 25/36 | Mul SSE128 Integer | 2.01 | 2.24 | 4.21 | 1.07 | 4.17 | 1.08 | 4.52 | 1 |
| 26/36 | Or Integer 64 | 3.5 | 4.28 | 3.51 | 4.28 | 3.5 | 4.28 | 2.84 | 5.28 |
| 27/36 | Sub AVX256 Float | 8 | 2.25 | 8 | 2.25 | 8.01 | 2.25 | 8 | 2.25 |
| 28/36 | Sub AVX256 Integer | 3 | 5.99 | 4.25 | 4.23 | 3.5 | 5.14 | 3 | 6 |
| 29/36 | Sub AVX512 Float | not supported | not supported | 16 | 1.12 | 8.01 | 2.25 | ||
| 30/36 | Sub AVX512 Integer | not supported | not supported | 4 | 4.5 | 3.02 | 5.96 | ||
| 31/36 | Sub Integer 64 | 2.33 | 6.43 | 3.5 | 4.28 | 3 | 5 | 2.36 | 6.35 |
| 32/36 | Sub SSE128 Float | 8 | 2.25 | 8 | 2.25 | 8.01 | 2.25 | 8.01 | 2.25 |
| 33/36 | Sub SSE128 Integer | 4 | 4.5 | 4.25 | 4.23 | 3.5 | 5.14 | 3.01 | 5.99 |
| 34/36 | Xor Integer 64 | 3 | 5 | 3.5 | 4.28 | 3 | 5 | 2.37 | 6.33 |
| 35/36 | Zen FPU Mix 21 | 1.25 | 3.6 | 2 | 2.25 | 2 | 2.25 | 1.35 | 3.34 |
| 36/36 | Zen FPU Mix 22 | 1 | 4.5 | 2 | 2.25 | 2 | 2.25 | 1.36 | 3.32 |
| Average all tests w/o AVX512 | 3.43 | 3.37 | 4.45 | 2.64 | 3.9 | 2.9 | 3.63 | 3.4 | |
| Average all tests w AVX512 | not supported | not supported | 6.11 | 2.63 | 5.25 | 3.14 | |||
Application Benchmarks
The application benchmarks suite is not very extensive, but contains what is important for many users in everyday life: video processing, compiling code, packing and unpacking files. Streaming would have been desirable, but had to be postponed to later for time reasons. Cinebench R23 cannot be missing as a very well-known benchmark tool of course. The results are known to many people and allow an adequate assessment of the CPU performance.
Cinebench R23
The values for the R9 5950X were not measured by us, since the CPU was not available for the tests. They were taken from the Cinebench R23 Community Benchmark from ComputerBase.
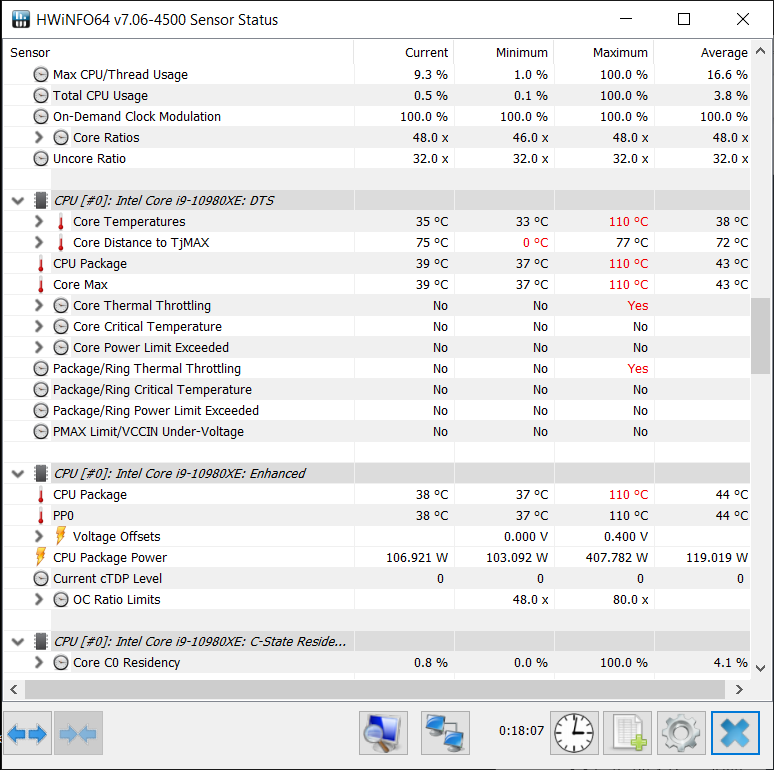
The i9-10980XE can play right at the top in terms of multi-core performance despite the old Skylake architecture, but that comes at a cost. The peak package power was over 400 watts according to HWiNFO.
7-Zip File Manager
Adobe Premiere Pro

Compiling VS 2019 C++

Benchmark Suite
The used game benchmark suite includes a total of 10 games. The majority of the games are selected in such a way that the CPUs are heavily stressed. The achieved frame rates are partly significantly below what modern monitors can display. Exceptionally, 2 titles with integrated benchmarks (built-in) are also used this time to cover heavily cache-heavy scenarios. This way, it becomes clear whether the larger L3 cache that Alder Lake brings along has positive effects on gaming performance. Ryzen 5000 CPUs are known to be able to flex their muscles in cache-heavy scenarios with their large L3 caches. AMD doesn't call it "game cache" for nothing. What might seem surprising to some is the use of ray tracing for CPU tests. However, considering that ray tracing puts additional load on the CPU due to the lack of culling and an increased number of draw calls due to objects outside the invisible screen space makes the decision understandable.
- Cyberpunk 2077 (Raytracing)
- Crysis Remastered (Raytracing)
- Shadow of the Tomb Raider
- Hitman 3
- Star Wars Jedi: Fallen Order
- The Ascent (Raytracing)
- Fary Cry 6 (Raytracing)
- Metro Exodus Enhanced Edition (Raytracing)
- The Division 2 (Built-in)
- Rainbow Six Siege (Built-in)
Gaming Benchmarks
The gaming benchmarks were performed at two resolutions this time. 720p is to ensure CPU limitation and 1080p was covered because 720p alone causes discomfort for many readers due to its practical relevance. Until graphics cards are really fast enough for 1080p as the only resolution the combination of 720p and 1080p will be standard here on capframex.com in the future. RAM OC results are also listed in each case, but DDR4-3200 is set as the baseline and will be the reference later in the overall ranking. If videos are missing from the Youtube playlist, they will be added later.
Results 720p and 1080p
Crysis Remastered
- API: DirectX 11
- Engine: CryENGINE 5.6
- Special aspects: Detail level increases automatically with increasing resolution
- Scene and Settings: Video
Cyberpunk 2077
- API: DirectX 12
- Engine: RED Engine 4
- Special aspects: Streaming-heavy scene
- Scene and Settings: Video
Far Cry 6
- API: DirectX 12
- Engine: Dunia 2 Engine
- Special aspects: Very single-thread bound
- Scene and Settings: Video
Hitman 3
- API: DirectX 12
- Engine: Glacier Engine
- Scene and Settings: Video
Metro Exodus Enhanced Edition
- API: DirectX 12
- Engine: 4A Engine
- Scene and Settings: Video
Rainbow Six Siege
- API: Vulkan
- Engine: AnvilNext 2.0
- Special aspects: Very cache-heavy
- Scene and Settings: Video
Shadow of the Tomb Raider
- API: DirectX 12
- Engine: Foundation Engine
- Scene and Settings: Video
Star Wars Jedi: Fallen Order
- API: DirectX 11
- Engine: Unreal Engine 4
- Special aspects: Very single-thread bound together with Radeon driver
- Scene and Settings: Video
The Ascent
- API: DirectX 12
- Engine: Unreal Engine 4
- Scene and Settings: Video
The Division 2
- API: DirectX 12
- Engine: Snowdrop Engine
- Scene and Settings: Video
Overall ranking 720p
The overall ranking is based once on the average FPS and additionally on the 1% percentile of the 720p benchmarks. It is important to note that the 12900K with DDR4 without OC is the baseline and therefore defines the relative positioning of all other results.
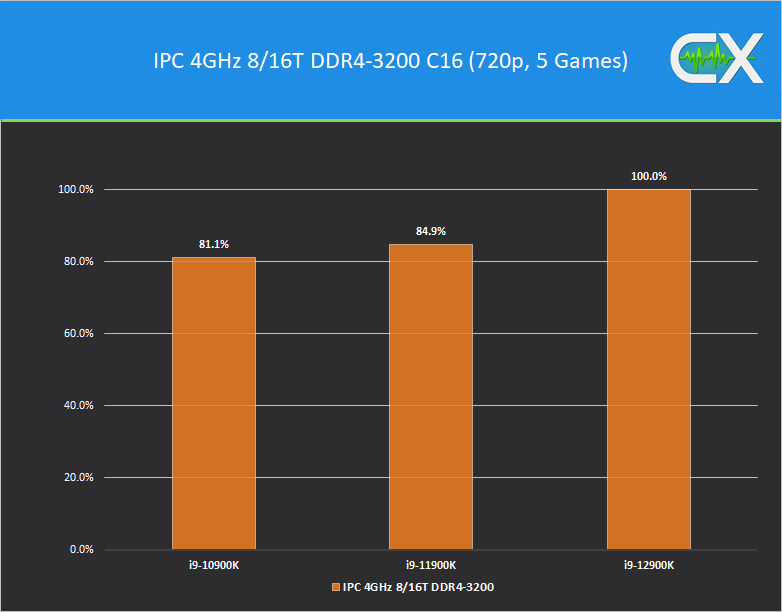
Gaming IPC 4GHz 8/16T
The gaming IPC was determined via a subset of the benchmark suite. The core clock was fixed at 4GHz. The cores were configured so that the Intel CPU had 8 cores and 16 threads enabled. The average FPS were used to calculate the IPC. The benchmarks has been done at 720p.
- Cyberpunk 2077
- Fary Cry 6
- Metro Exodus Enhanced Edition
- Star Wars Jedi: Fallen Order
- The Division 2
30MB vs 20MB L3 Cache (Update 11/07/21)
As it was mentioned at the beginning the L3 cache has a big impact on gaming performance. To investigate this further, the 12600K and 12900K are compared in 5 games. Both CPUs are clocked at 4GHz and the E cores are completely disabled. In order to use the same amount of P Cores for the benchmarks 2 of the 12900K's 8 P Cores are disabled.
- Cyberpunk 2077
- Fary Cry 6
- Metro Exodus Enhanced Edition
- Star Wars Jedi: Fallen Order
- The Division 2

Star Wars Jedi: Fallen Order shows a clear advantage of the additional 10MB L3 cache with almost 8%. Cyberpunk 2077 on the other hand runs only 3.3% faster. On average, the advantage of the larger L3 caches is slightly less than 6%.
Package Power Games 720p
CapFrameX was configured to record the package power (W) of each CPU during the gaming benchmarks. The following table shows the average package power per session at 720p.
| Package Power W | R9 3950X DDR4-3200 142W PPT | R9 5900X DDR4-3200 142W PPT | i9-10900K DDR4-3200 125/250W | i9-11900K DDR4-3200 125/251W | i5-12600K DDR4-3200 150/150W | i9-12900K DDR4-3200 241/241W | i9-12900K (P Cores) DDR4-3200 241/241W | i9-12900K DDR4-3700 241/241W | i9-12900K DDR5-5400 241/241W |
|---|---|---|---|---|---|---|---|---|---|
| Crysis Remastered | 76 | 96 | 79 | 100 | 58 | 92 | 80 | 109 | 101 |
| Cyberpunk 2077 | 94 | 112 | 134 | 132 | 80 | 130 | 139 | 134 | 158 |
| Fary Cry 6 | 79 | 96 | 87 | 107 | 58 | 85 | 90 | 112 | 105 |
| Hitman 3 | 81 | 97 | 85 | 115 | 60 | 95 | 107 | 127 | 124 |
| Metro Exodus EE | 79 | 97 | 91 | 114 | 60 | 94 | 97 | 126 | 128 |
| Rainbow Six Siege | 85 | 106 | 92 | 112 | 62 | 93 | 108 | 122 | 127 |
| Shadow of the Tomb Raider | 90 | 110 | 94 | 131 | 71 | 103 | 124 | 142 | 146 |
| Star Wars Jedi: Fallen Order | 73 | 92 | 119 | 91 | 52 | 75 | 83 | 101 | 99 |
| The Ascent | 80 | 100 | 94 | 112 | 63 | 96 | 107 | 99 | 131 |
| The Division 2 | 90 | 109 | 103 | 118 | 65 | 100 | 113 | 133 | 139 |
Efficiency Ranking Games 720p
An efficiency ranking can be created with the consumption values (package power) and the average frame rates of the 720p tests. The quotients are first normalized and then averaged. The approach results in a relative representation of the efficiency values.

Conclusion
From a purely technical point of view, the launch of Alder Lake can be described as very successful. Congratulations Intel! The matter is unfortunately clouded a bit, but this is partly Intel's own fault.
First of all, referring to the question at the beginning of the article "Is Alder Lake a good gaming architecture?" one can answer: Yes, Alder Lake is an architecture that handles gaming excellently. A look at the gaming ranking reveals that the 12900K is up to 20-25% faster than AMD's Ryzen 5900X in some games and about 11% faster on average.
Of course, the results with RAM OC are not included in the overall conclusion. The 30MB L3 cache of the 12900K helps enormously in not being destroyed by the competition in heavily cache-heavy scenarios, as it was the case with Rocket Lake. But demanding memory-heavy scenes also suit the Rocket Lake successor. The gaming performance is uncompromisingly recommendable and an important point is that the efficiency does not suffer.
The big surprise in this test for me personally is also the gaming performance of DDR5. I deliberately decided against testing according to the specification in order to show readers the performance that is possible with normal and everyday tuning measures. To keep things fair, all gaming benchmarks were also run with overclocked DDR4. In the end, both memory standards (with OC) are on par. The interesting thing is that both memory tools showed worse latencies for the DDR5 memory. The CAS latency is clearly worse in comparison. As expected, the bandwidth is far above the DDR4 numbers. Games don't seem to care about the higher latencies, though. Either various DDR5 features can compensate this or games react more strongly to bandwidth than assumed. A combination of both is also conceivable, of course.
But what was Intel thinking when it threw the known approach to power management overboard? TDP is now "Processor Base Power" and PL1 equals PL2 as default in the BIOS.
 Source: Intel
In games, this doesn't have a significant impact, at least in terms of the benchmark suite used. The benefit in the application benchmarks turns out to be marginally in some cases. The question about the sense may be asked. Even with the old approach of PL1=125W, Tau=56s and PL2=241W, the 12900K is very strongly positioned compared to the 5900X. Did Intel want to reach for the stars, i.e. the 5950X? Even that doesn't always succeed. But does the 12900K with 8 Performance and 8 Efficient Cores have to keep up with a 16 core R9 5950X? Realistically, you shouldn't expect that in all areas. However, you can simply set a power limit in the BIOS without dramatizing the matter and still have a very strong CPU.
The launch is marred by high motherboard and memory prices. The VRMs of the boards seems oversized and is likely to be a major price driver. However, DDR5 also places higher demands on the signal quality of the boards, so that additional costs are incurred in production here as well. Understandably, this cannot be avoided. Nevertheless, it is to be hoped that prices will settle down to a better level.
