Version 1.7.0 is now available in the download section as well as on github.
This update introduces support for the upcoming Powernetics v2 and some other updates and fixes
Clarification on support of DLSS Frame Generation Feature
There was a misunderstanding that the Frame Generation feature of DLSS 3 was adding the additional frames on a driver level and that these frames couldn't get captured by PresentMon. But that isn't the case. CapFrameX(in every version) is 100% compatible with this new feature.
Powernetics v2 support
Powernetics v2 is a PMD tool to directly measure the power of connected components. You can run your PCIe power connectors, your EPS12V connector and your ATX connector through it and also measure the PCIe slot with a riser card.
CapFrameX includes an easy integration of this tool to show and also log the measured values.
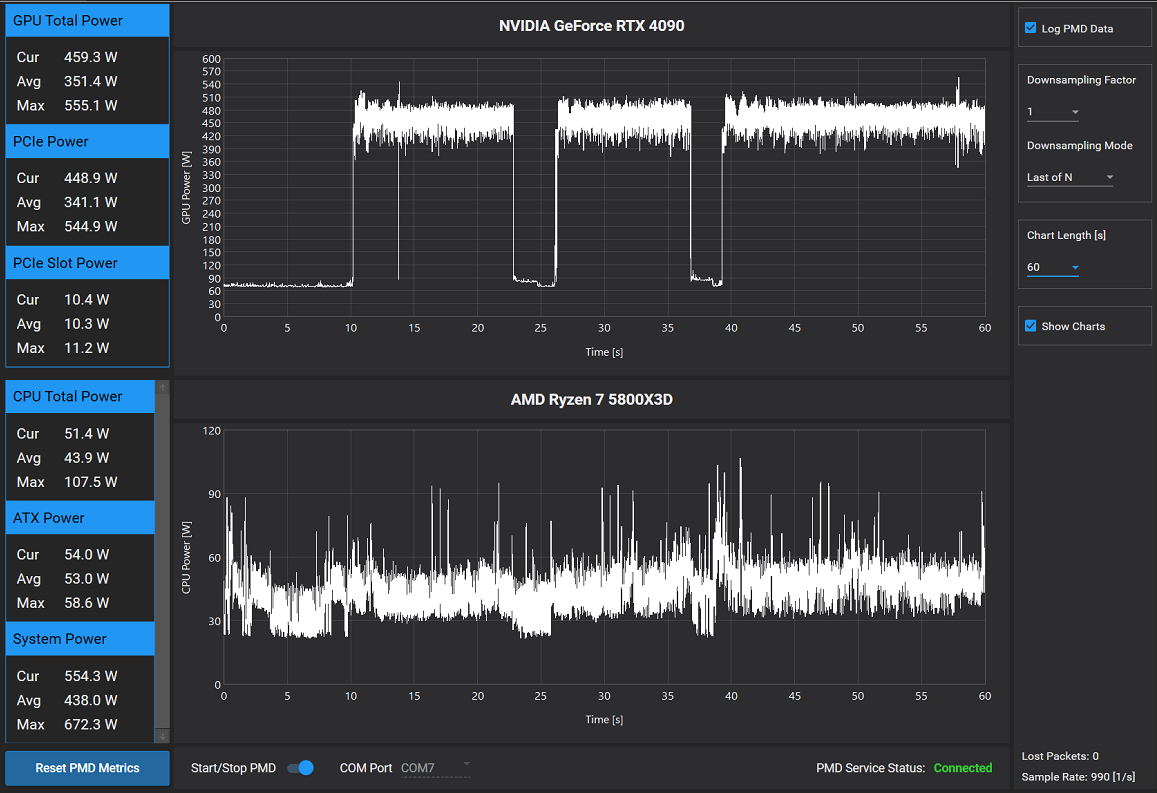
The first tab of the PMD view shows the real time current, average and maximum power values for CPU(EPS12V connector), GPU(PCIe Connectors + PCIe Slot = GPU Total Power), ATX(which also includes the PCIe Slot power) and System power(sum of CPU Power, PCIe Power and ATX Power).
GPU Total and CPU Total are shown as real time graphs with a configurable chart length and downsampling factor, which can be configured on the right side together with the option to log the PMD values together with your benchmarks.
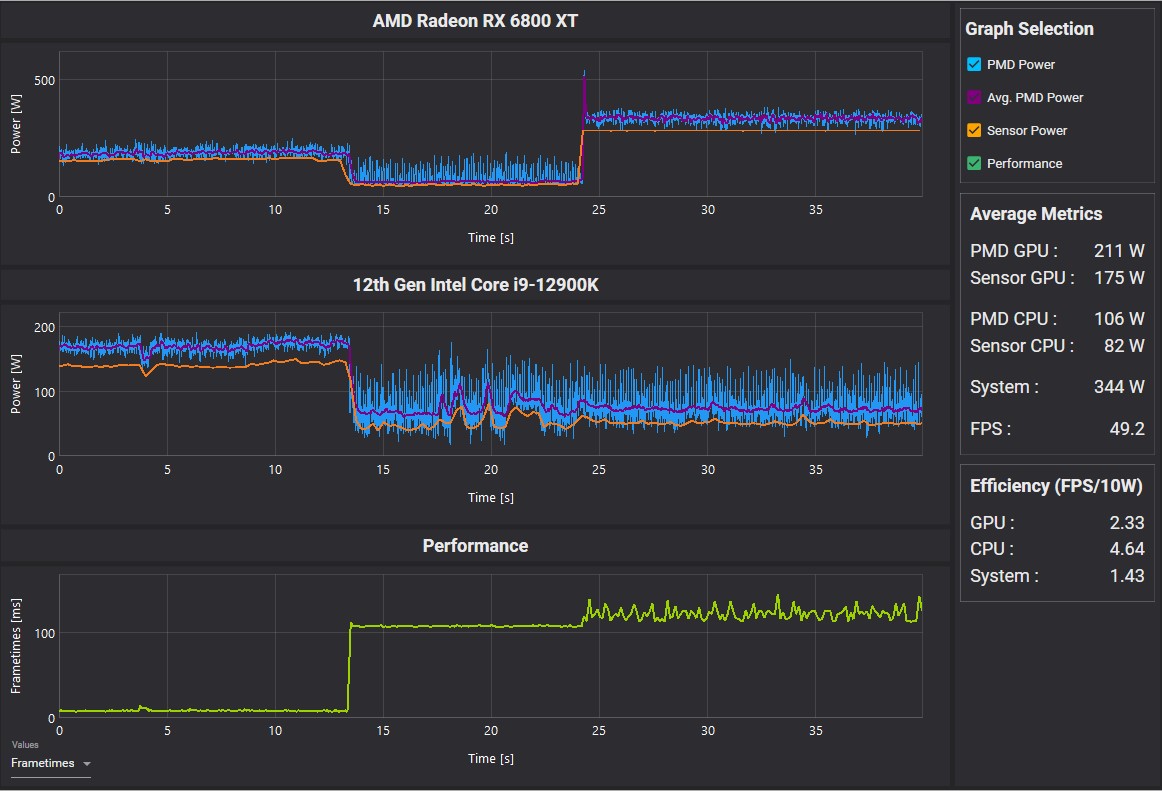
Once you made a capture with PMD logging enabled, you can then analyse it on the second tab which shows you the raw PMD power values aswell as an averaged value line.
Even if you don't have Powernetics v2 this page can still be useful as you can also show the sensor readings aswell.
On the right side you'll see the average values for the capture and also an efficiency rating. If available, it uses the PMD values, otherwise the sensor values will be used instead(which won't give you system power values of course).
Support for Nvidia FrameView log files, PC latency and x% low average metrics
In the past, we changed the x% low metrics to be integral values consistent with the default values from MSI Afterburner (x% low = for x% of total benchmark time, values are lower than this).
Now we included the old approach again (x% low = average of the lowest x% of all values) but also kept the integral x% lows so you can use both.
With the ability to analyse logs from Nvidias FrameView, you can now also see a PC latency metric on the analysis page, which is an exclusive metric of FrameView.

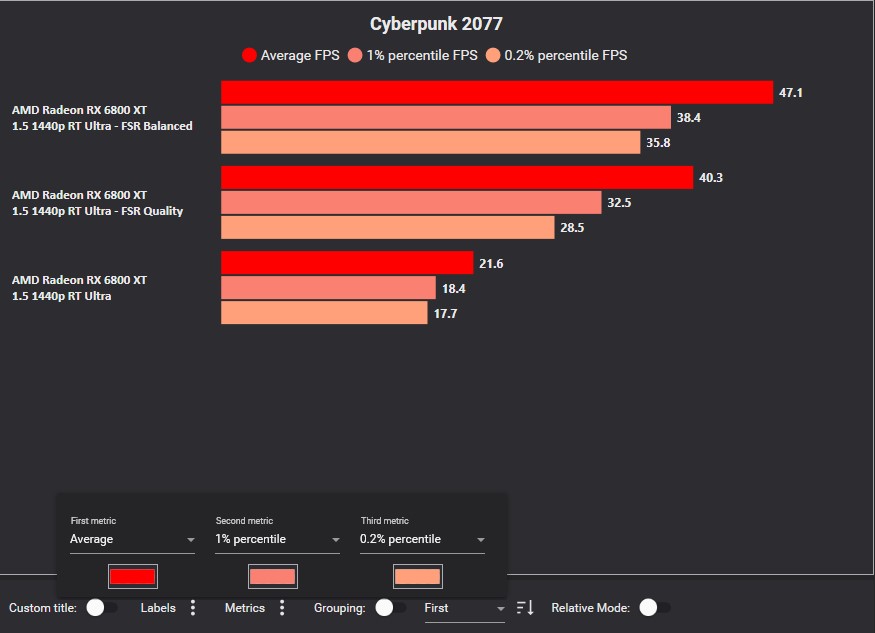
Custom bar chart color on comparison page
The metrics selection menu on the comparison page now includes a colorpicker for each metric so that you can now change the color of the individual bar charts.
Smarter sensor config behaviour
When changing hardware, the sensor config was just reset to default in previous versions. Now the sensor config remembers which sensors were selected with the old hardware and restores this selection on the new hardware for every sensor that is still available.
Bug fixes
A rare bug where moving a record to another folder through the tree view context menus unintentionally deleted the record.
When using a Zen4 CPU with enabled iGPU, sensor logging data couldn't be loaded on analysis and sensor page.
Real time metrics on the overlay may fail to update correctly.