Version 1.6.7 is now available in the download section as well as on github.
This update includes some UI changes to make better use of the available space and also some new sensors.
UI changes
Using CX in fullscreen mode or in generally bigger window sizes often leaves quite a bit of blank space that isn't utilized at all.
In most cases these areas have to remain that way because there isn't really anything that could be added there without having to compromise the view in smaller windows with scrollbars or additional menus.
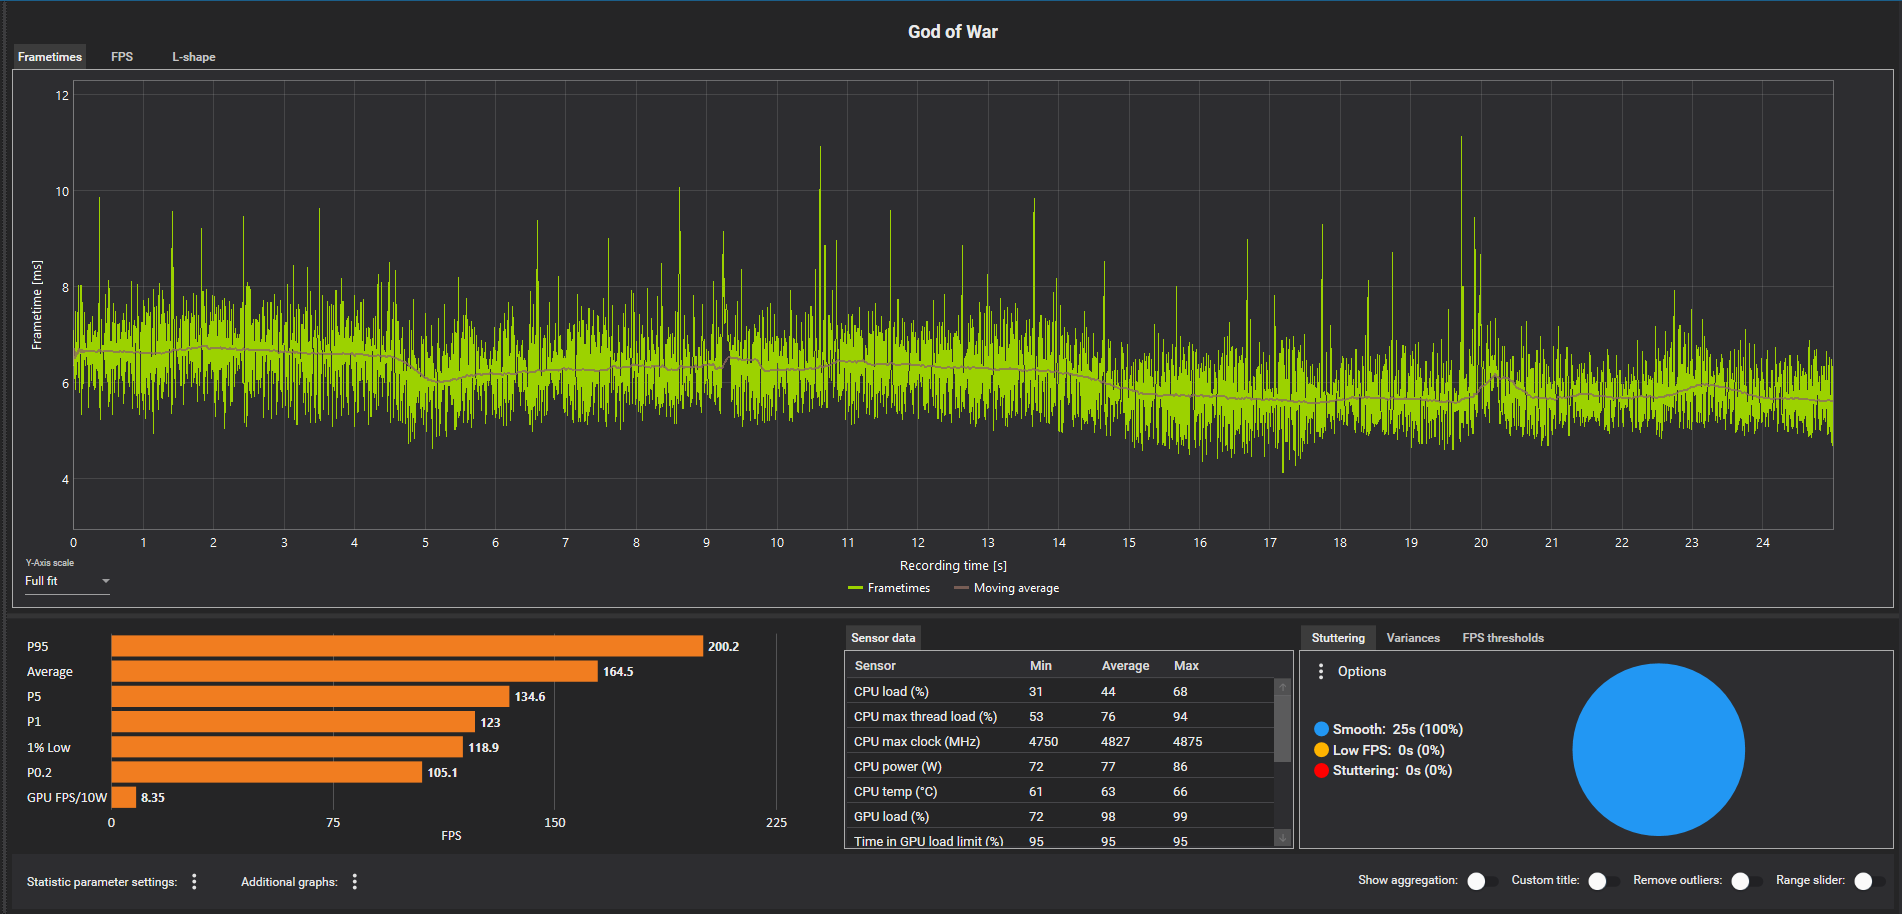
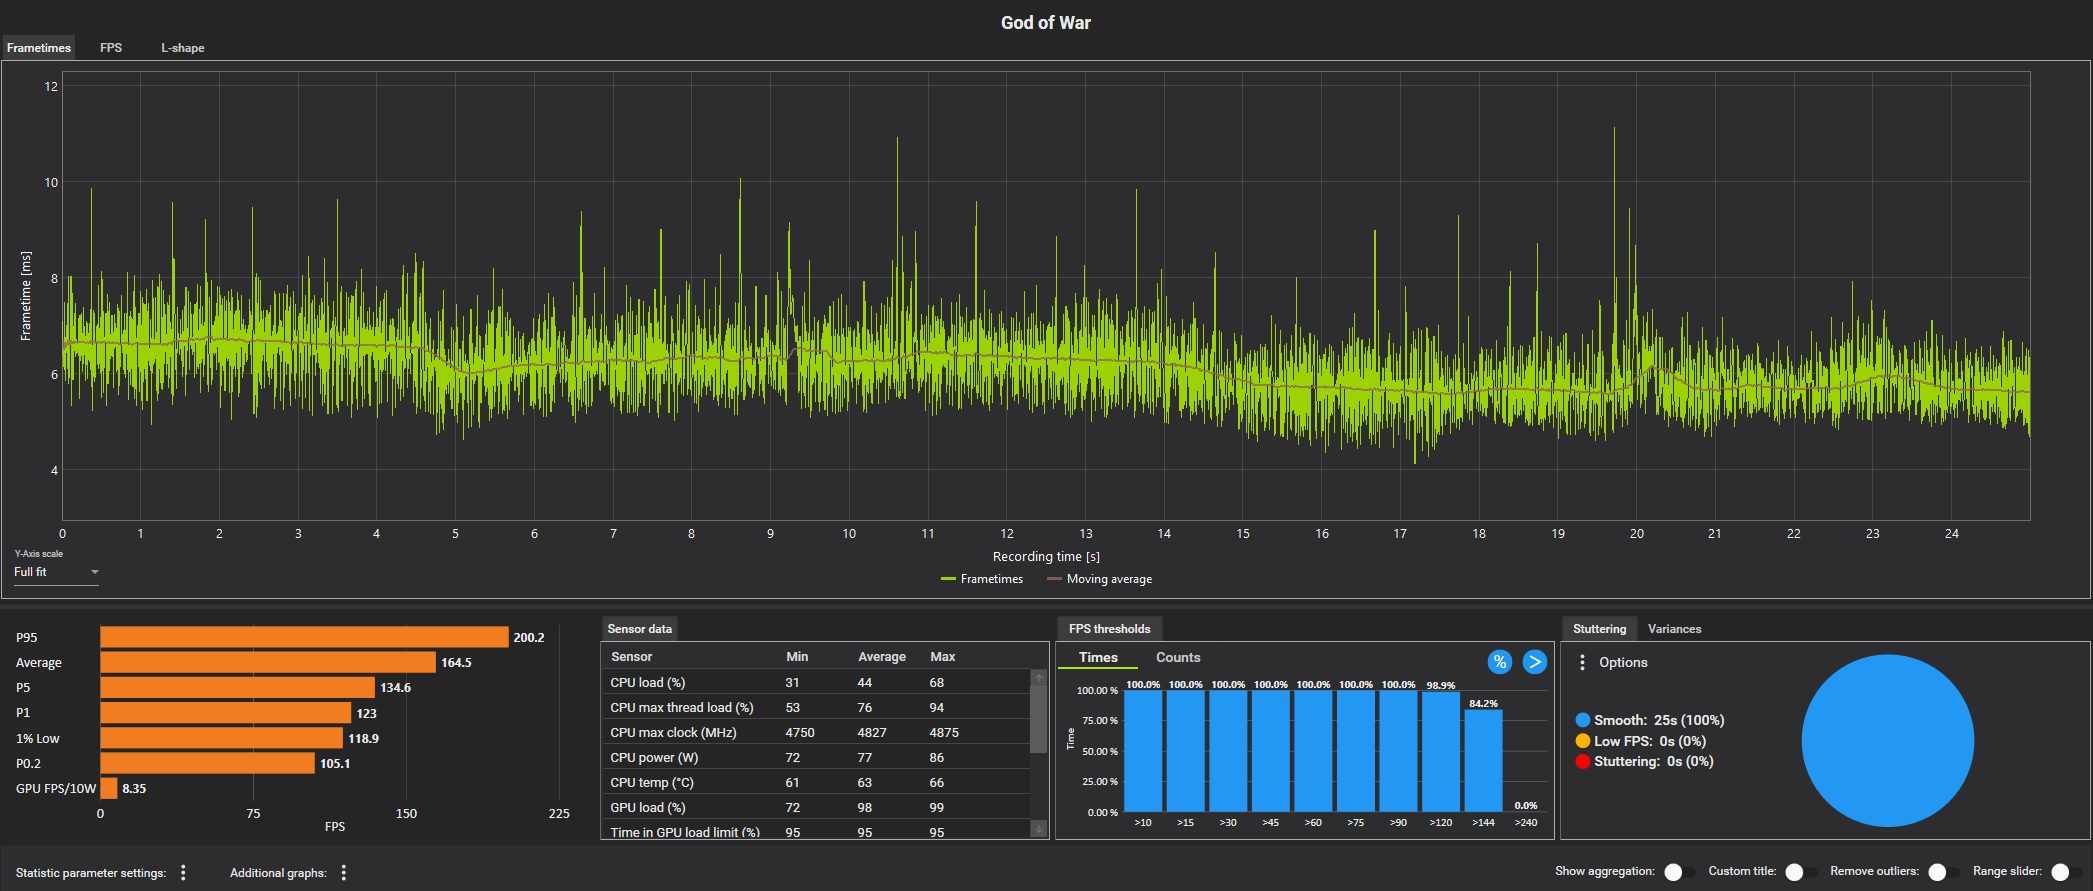
However on the analysis page, we took the multi-tab view at the bottom right and made it so that it separates in up to 3 single tabs depending on the width of the window to make use of the space. These tabs will dynamically change as you rezise the window.


In addition to that, almost all font sizes were increased a bit to make them better readable on high resolution displays.
Raptor Lake Support
Initial support for sensor data regarding the upcoming Raptor Lake was added.
New sensors
Additional sensors for Zen2 and Zen3 CPUs were added so that you can now also see the individual core voltages.
Also there's a new experimental "sensor" for users of AMD RDNA or RDNA2 GPUs. This sensor is called "TBP Sim" and tries to state the actual GPUs power draw as close as possible.
Because AMD cards don't have a dedicated sensor for the full TBP, the one closest to it the TGP value, which is the chip+memory power. This doesn't factor in losses from VRM efficiency and also some other parts of the PCB.
In order to get a formula for this sensor to be applied to the TGP reading, we've gathered multiple benchmarks where the cards power consumption was measured using PCAT and comparing the actual power draw with the corresponding TGP values. These were done not only at full load but also with FPS limiters in place to see how the difference changes at lower load.
In the end, this is still just an approximation because there are many factors that can affect power consumption which we can't control, for example different fan counts and settings.
By making the formula fit equally for all the different PCAT/TGP comparisons we have, we're pretty confident that this TBP Sim value will match what you'd measure with PCAT with a deviation of 1-2W at best and 4-5W at worst.
The only exception is idle state because in addition to a relative offset, we needed to match the behaviour of the relative difference between TGP and TBP getting larger at lower TGP readings. For this we've added a small fixed value that is always added(so it has a larger impact at lower TGP and a smaller at higher TGP), which logically doesn't work when the card isn't doing any work at all. Here the reading will most likely be a little too high because of the added offset.
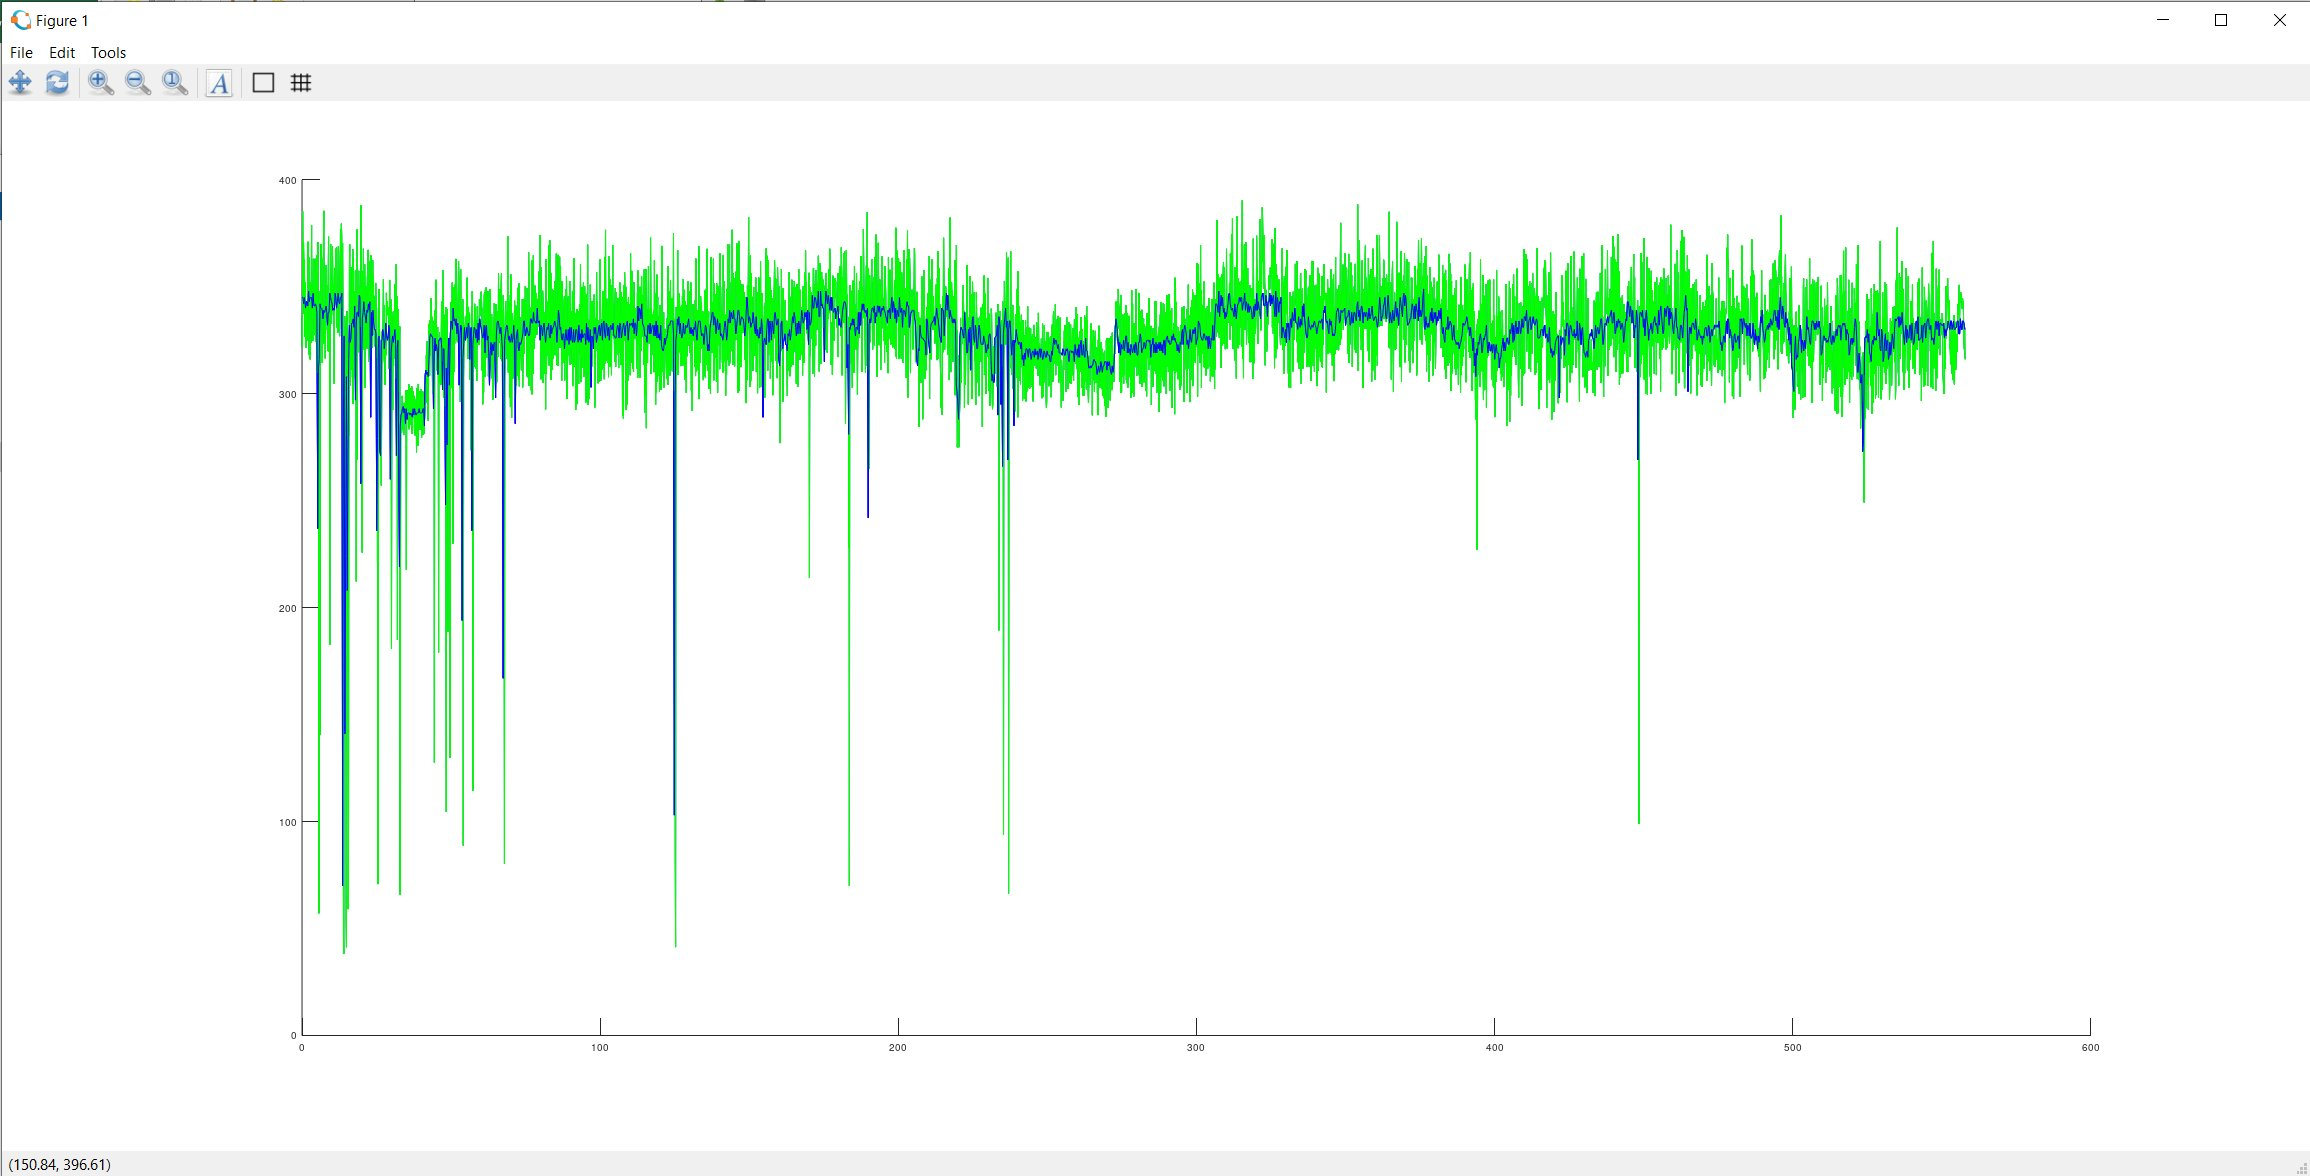
 Green line graph is an Nvidia PCAT measurement and blue line graph is the CX TGB Sim sensor. Few minutes Dying Light 2 gameplay on RX 6800 XT OC.
If you chose to log this sensor via the sensor page, it's value will be visible in the sensor tab on the analysis page and also on the report page. Furthermore the options menu got a checkbox where you can change which values will be used for other analysis purposes like the FPS/W metrics. By default, the standard TGP values will be used for this but if checked, the TBP Sim values will be used instead if they are present in the records sensor data, otherwise TGP will be used.
