Version 1.6.6 is now available in the download section as well as on github.
This update includes the support for Intel Alder Lake CPUs and offers UI improvements together with some other additions.
Support for Intel Alder Lake CPUs
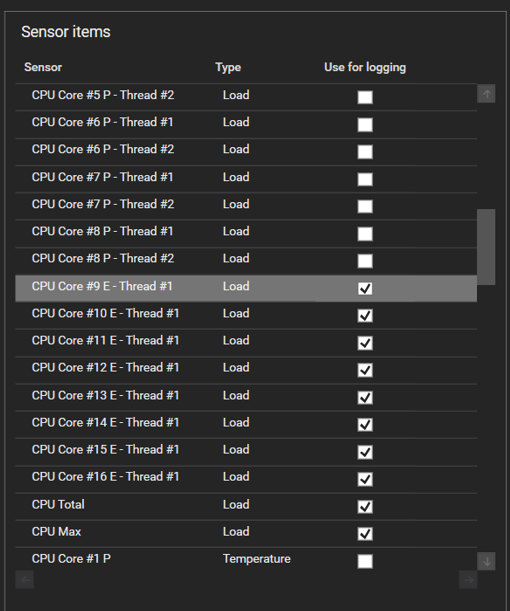
CapFrameX now supports Alder Lake CPUs and their heterogeneous design with dedicated performance- and efficiency-cores.
All usual sensor values are available and the cores/threads are marked with "P" and "E" to indicate if a core is a performance core or an efficiency core.
Move Record files in tree view with Drag & Drop
When you pinned the tree view expander so that it always stays open, you can now move files from the currently observed directory to any other directory in your root folder by dragging it over the different tree view folders. This also works with multiple selected files at once.
Notice that this doesn't copy the records, but completely moves them to a new directory. If you want to copy them, you can still use the context menu for that.
More infos in system info expander
The expander on the Analysis page now also shows the status of ResizableBar, Windows Game Mode and HAGS for new record files. Also the OS version is now displayed again, which wasn't the case due to a prior bug.
Notifications inside the app
We've added the possibility for us to dynamically display a message at the top of the application when there is a need to do so.
These messages come directly from our server so you need internet connection to see them. They are being checked at every start of the app but once a message is closed, nothing will show up on app start until there is a new/different message available.
This comes in handy to share important information to our users that don't follow every Twitter post or aren't active in other communities.
One example for a situation where such a message would be useful will be seen when you first start this new version, because a bug happened that needs action from every single user that could potentially be affected by it.

You can disable these messages in the options menu, but we advise you to leave them turned on. We won't spam you with messages, this feature is only for important cases that hopefully stay very rare.
Changes to variances and input lag calculation
Separation of runs
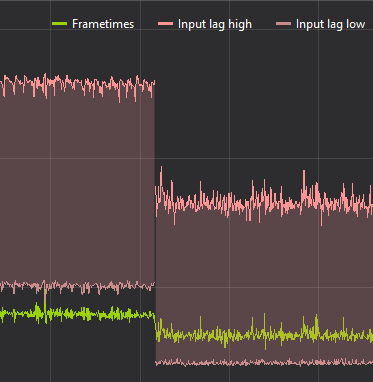
It was pointed out to us, that our calculation for the input lag can include values from two different runs of an aggregation because we just use all of the frametime data together to calculate the values. The same was true for the calculation of variances, so both were changed to now seperately calculate the values for each independend run and then joining them together. This eliminates the comparison of the last frame of one run with the first frame of the next run.
For the input lag graphs of aggregated records, in order to keep the values linked to their frametime values, you'll now see very small gaps at the start of every new run because the input lag uses information from two previous frames and therefor can't be calculated until the third frame of each run.
Adjusted formula for input lag
Also the lower and upper bound calculations of the input lag were changed. Both of these bounds were made to give the lowest and highest possible input lag approximation, that could be derived from the PresentMon data.
However, both relied on the assumption that an input was sampled immediately after a PresentCall, which already gave them kind of a worst case value.
The lower bound now assumes that an input was sampled immediately before a PresentCall, which is the best case and lowest possible input lag.
The upper bound still works the old way, but now also includes time of dropped frames that came before a displayed one.
In summary, if there are no dropped frames, the expected input lag will be a bit lower from now on because of the new lower bound. And if there are dropped frames, the expected input lag might be getting a bit higher, depending on the amount of droppd frames and how much the upper bound is affected.
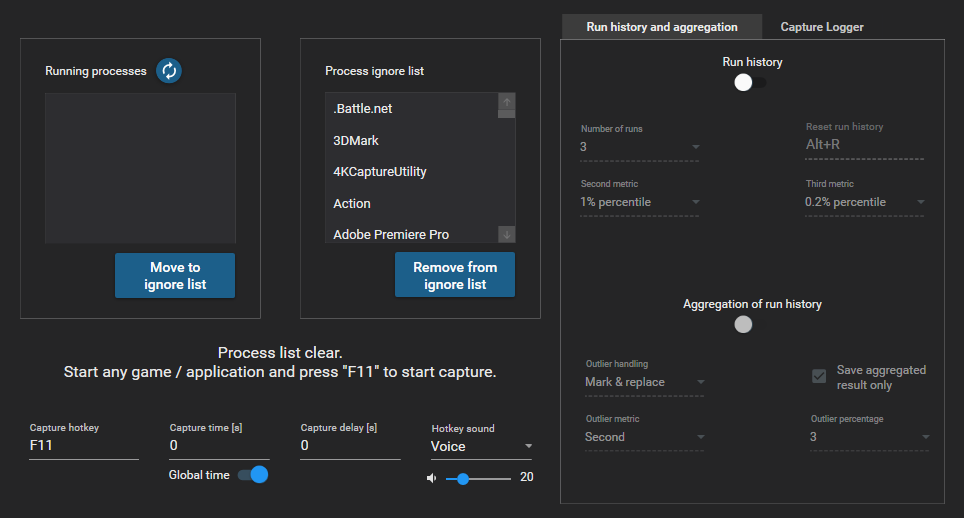
Run history and aggregation options moved
The options for the run history and the aggregation were moved from the Overlay to the Capture page because although the history is shown on the overlay, together with the aggregation these options are more logically connected to the capturing process. They share their position in a tab control with the capture logger.
This is only a design choice that doesn't affect any of the functionality.
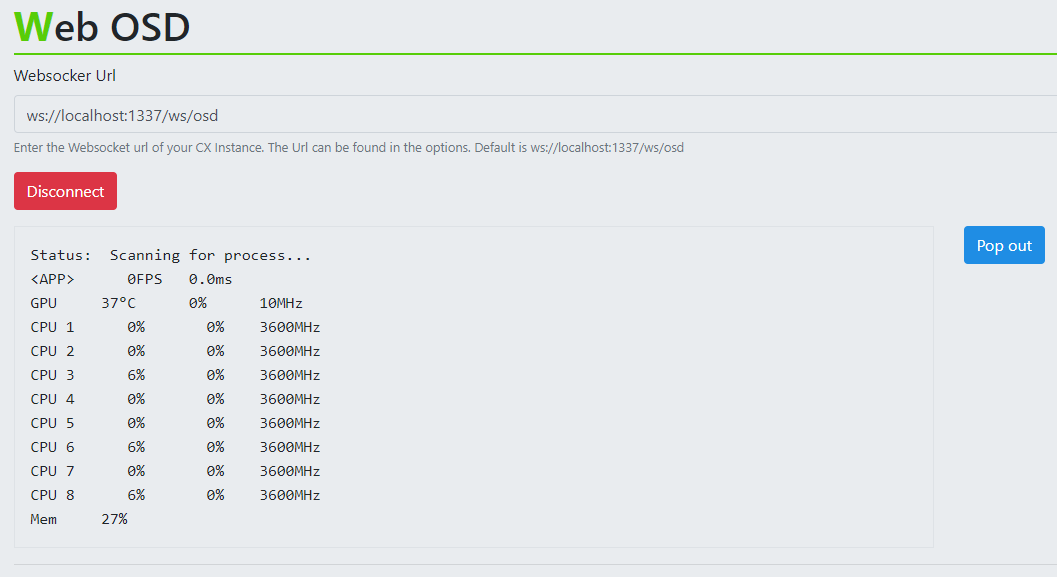
Overlay info available via http and websocket
Because of a users request, who wanted to display some real-time sensor data on a mini LCD attached to a microcontroller, we've implemented a server from which you can pull a JSON containing the current overlay items, either via http request or via websocket.
The two links are available in the options menu, if you want to test the websocket, you can connect your running CX at capframex.com/osd.
The options menu also got a new checkbox to disable our output to RTSS and only retrieve the overlay from the URLs. That way you can view the info on an external device without also seeing the overlay on your screen.
Other changes
The number of records inside the currently observed directory is now shown next to the directory name in the search bar above the record list.
RTSS Overlay formats were compressed further to be able to potentially show even more lines before the overlay glitches.
Autostart is now performed through Windows scheduled tasks instead of using a registry key, so users with active UAC don't get these messages on startup anymore.
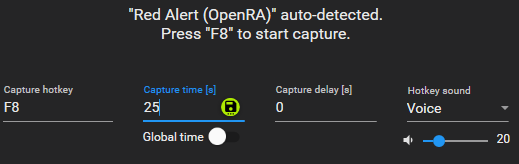
Saving of a custom capture time for different processes has been changed to a manual button press. In previous versions, you had to finish a capture with a set time while having the global time toggle turned off in order for that time to be saved to the process list.
Now any time you type in a capture time while not using global time, that time is checked against what is saved in the process list and you get a save button to directly save it as the new standard that gets filled in whenever that process is detected.
Bug fixes
We've tried to further minimize potential app crashes regarding playing sounds and getting sensor entries.