Version 1.6.5 is now available in the download section as well as on github.
This version introduces some new analysis features and bug fixes.
New "Show aggregation" toggle on Analysis page
This feature is useful when you have aggregations that don't consist of just one scene multiple times, so first of all a tip about the use of the aggregation feature:
The aggregation can not only be used to increase the data quality of a single benchmark scene by aggregating multiple runs of that scene but also to combine different scenes of a game.
You could for example do a very demanding scene and give people the FPS values based on that scene alone, but when this scene only makes up like 10% of a typical playthrough, it's not very informative for people who want to know what performance they can expect.
Now you can also take a scene that is more in line with how the game usually performs and another scene where performance is higher than usual.
When you aggregate these scenes, making a 10s benchmark of the worst case scene, a 70s bench of the typical scene and a 20s bench of the best case scene(or use the same length for all scenes but use the more frequent scene multiple times for aggregation), you end up with an average FPS value that is more representative of the entire game and also a percentile or % low value that is still representative of the worst case scene.
Now people can get an idea of how their hardware performs in worst case scenarios while at the same time get an average for the entire game instead of just an average of the worst case scenario.
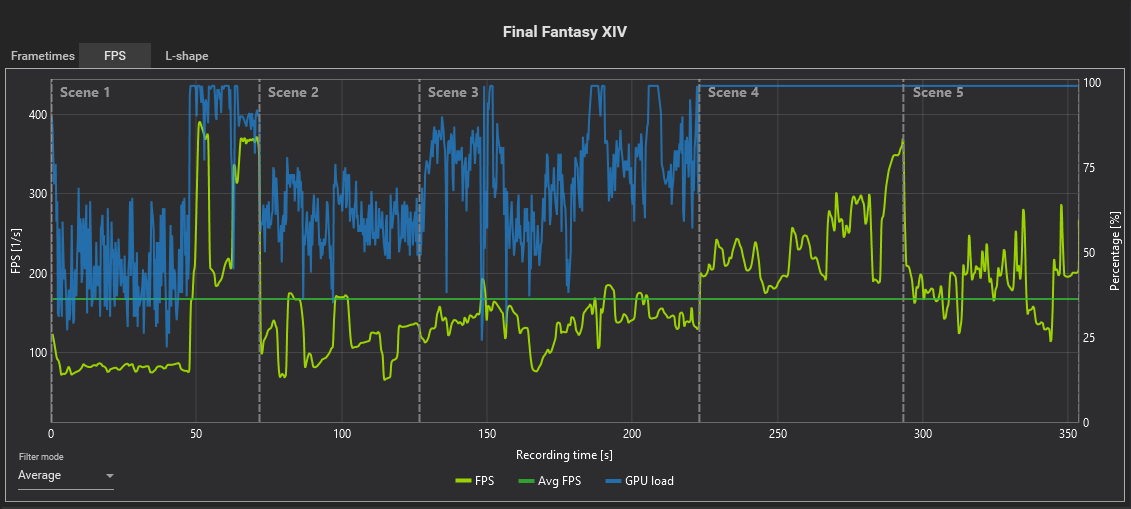
Now to the new addition: Sometimes it's apparent from the FPS values where a new scene started, but sometimes it's not, so to see these different scenes, we've added the option to show separators on aggregated benchmarks for every run included in the bench.
Here's an example of the integrated benchmark of Final Fantasy XIV that contains five different scenes
New "Variances" tab on Analysis and Comparison page
We always liked the frametime variance charts on igorsLab (example) and thought why not include something like this on CX too?
So variances are now available on the Analysis as well as on the Comparison page.
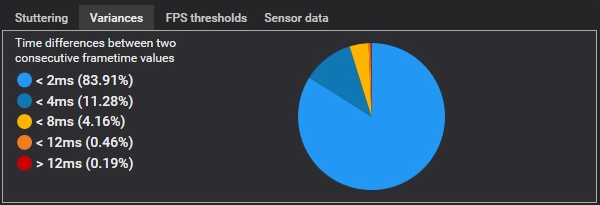
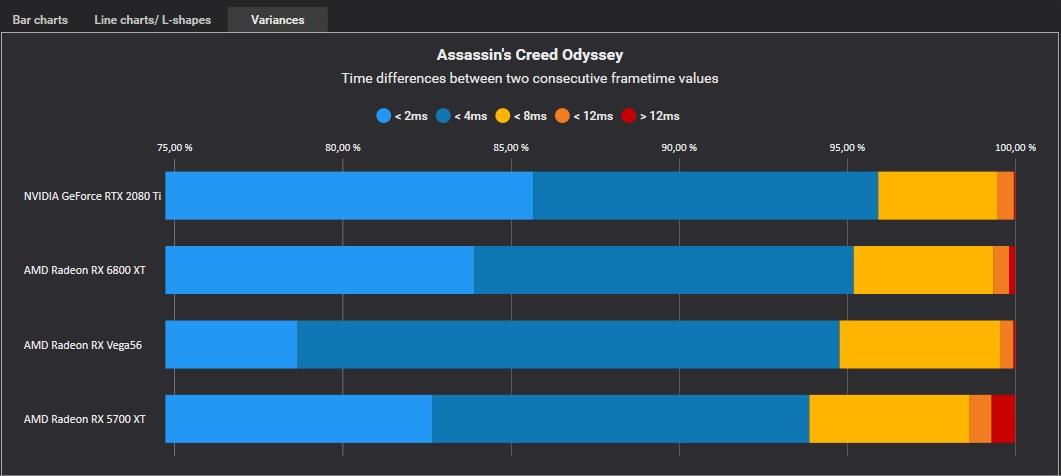
In short, variances are the differences between two consecutive frametime values. Every frametime is compared to the frametime before it and the differences get sorted into the bins you see in the chart legend.
Analysis page
The Analysis page shows the variances as a pie chart with the precise percentage values in the chart legend. The chart always shows all the values.
Comparison page
The comparison page shows the variances as stacked row charts to easily compare different records.
By default the charts are scaled so that you can better see all bins but you can also set it to go from 0-100%.
Also they can be sorted by ascending and descending, the sorting value being the sum of "<2ms" and "<4ms".
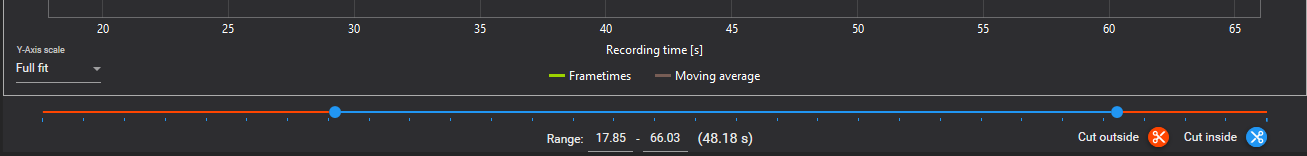
"Inverse cut" added to Range slider on Analysis page
The cutting option within the range slider is already useful when you want to trim the start or end time of a record. You can just move the range slider exactly where you want your benchmark to be and then cut it to save this range as a new file.
The opposite is now also possible: You can use the range slider to select a part of the benchmark that you don't want to have included, with the new button, everything outside of the selection will be saved as a new file and the data inside of the selection will be removed.
We've colorized both segments of the range slider to better implicate what the two buttons do. As a change from previous versions, "Cut" now means removing data, not keeping it, so the button for the standard cutting feature is now the red one (tool tips added to avoid any confusion).
"Hotspot" sensors for Nvidia cards
If you own an Nvidia GPU, you can now see and log the GPU core junction temperature and if your GPU has GDDR6X memory on it, also the memory junction temperature.
Other enhancements
Cutting a record with the range slider now adds a "(Cut) " to the comment line of the created record so that users instantly know which record is the result of a cut.
App latency and some standard sensor values (like CPU and GPU usage, power, temps) were added to the report page to be compared. Also copy to clipboard does now only copy the columns that are currently visible.
Bug fixes
When a record didn't contain sensor data, the range slider cutting wouldn't work. It also had problems when cutting aggregated files when more than the last aggregate was cut away.
By various reports about very slow building of graphs(30s and more) and a very high RAM usage (5GB and more) of CX while bulding a graph since version 1.6.4, we've discovered, that our "GPU accelleration" toggle was the problem.
GPU accelleration makes the graphs slower by a great amount, but because it's only a relative time increase we didn't notice this when using smaller files. Version 1.6.4 introduced a new rendering mode for the graphs which made large graphs way more performant but also made the problem with GPU accelleration on these large graphs way worse.
Since CX doesn't currently use anything that benefits from having GPU accelleration turned on, we've removed the toggle.
We also did some tweaks to prevent CX from crashing when trying to save the config file, although because we never had that problem ourselfes, we don't know if it helped.