Version 1.6.4 is now available in the download section as well as on github.
This version introduces performance improvements, some new features and some bug fixes.
Better performance for large graphs
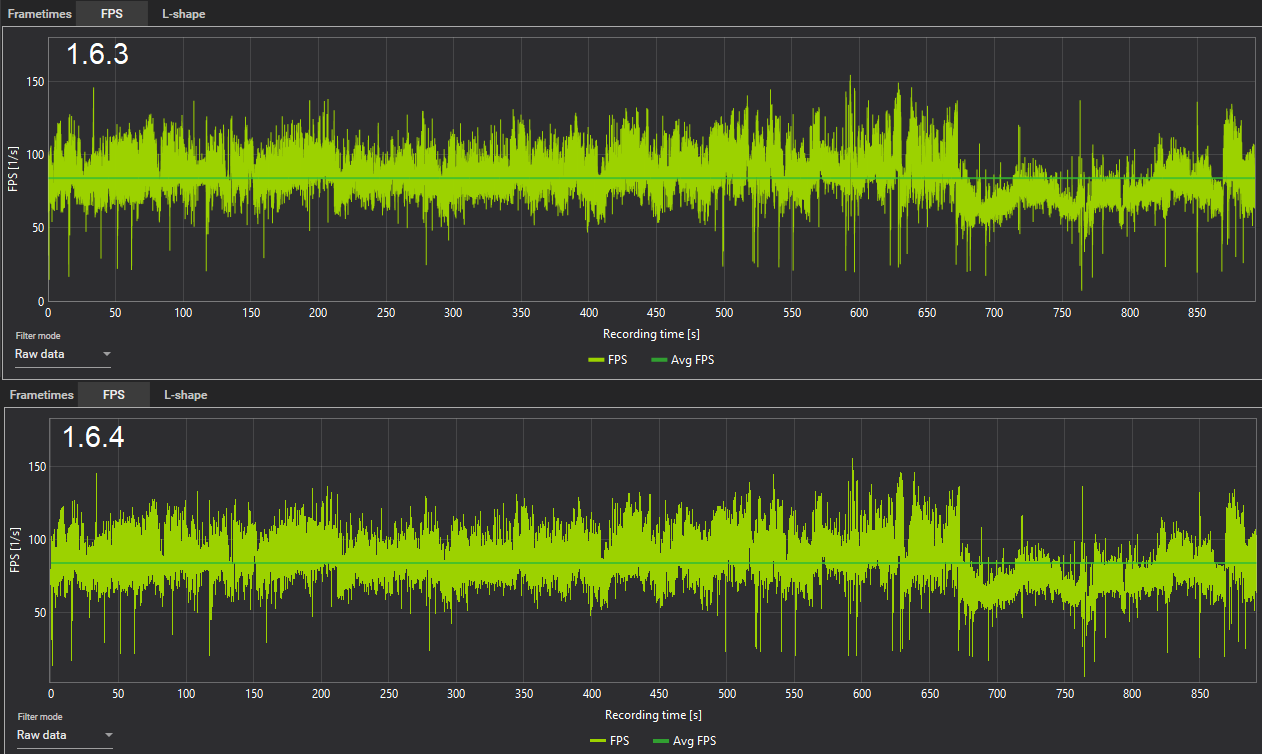
The performance of graphs mainly depends on the length of the lines between the different points, so the more points and variety between those points exist, the slower will the control behave when zooming or moving the graphs around.
We've updated our OxyPlot libraries to enable a new performance mode for rendering the graphs. At the cost of smoothing and anti-aliasing, this improved the performance for these large graphs by a great amount. Here is a comparison of how the graphs look.
New global time toggle
We've had a request to set a custom capture time period for each process a while ago and have now implemented this possibility.
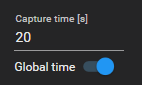
The global time toggle below the capture time box is activated by default and with that, capture time will work just like it has before, in this case using 20s for every benchmark.
When you disable that toggle, the time you set for a process will be saved in the process list after completing the capture and every time that process gets recognized again, the time will be written into the capture time box. This can be useful if you have scenes with different duration for different games or are using built-in benchmarks that also differ in length from game to game, so you don't have to adjust the capture time whenever you switch to another game.
You can also always enable the toggle to use the last known global time again, while the individual times for the processes will only be saved or changed when this toggle is off.
Application latency as overlay item
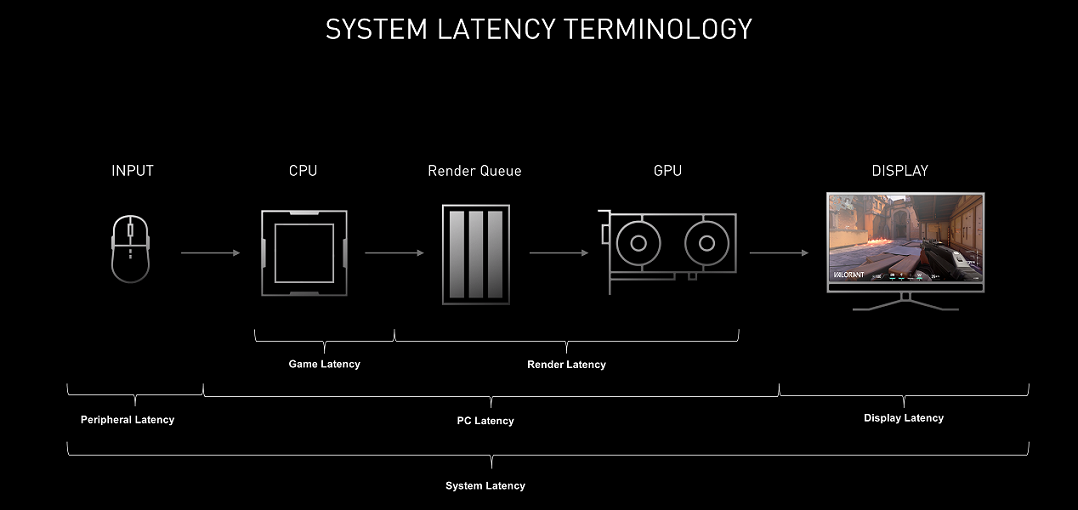
The calculations for the input lag data on the Sync page were built into the online metrics so you can now show the current average latency while playing.
This value is the same as the "expected" input lag(average between upper and lower bound values) but with the input lag offset(display and keyboard latency) removed, so it corresponds to the "PC latency" in this diagramm of Nvidia:
Selectable and persistent columns for the record list
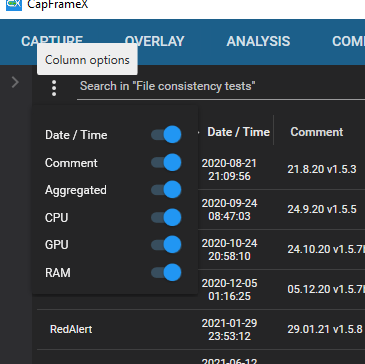
The record list now has an option at the top to select which columns you want to see in that list. Also the order of these columns is now persistent upon app restart.
Bug fixes
- Captures made with PresentMon 1.7.0 were not fully recognized by CX, meaning they didn't show a process name or creation date.
- The first metric on the Comparison page was not persistent upon app restart
- When exporting a graph as PNG file, the background color of the graph would change and no longer responds to the dark mode toggle.
- A rare bug occured where you start CX but the window won't show, just a taskbar icon and the only thing you'd see is this
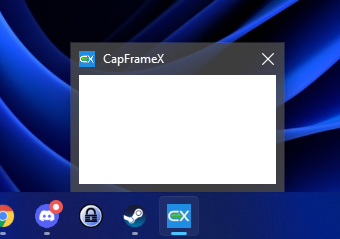
We believe to have found the cause of this bug and hopefully fixed it.