Version 1.5.8 is now available in the download section aswell as on github.
While version 1.5.7beta only contained a bug fix compared to version 1.5.6, this version comes with an all new sensor page and various other small additions and enhancements.
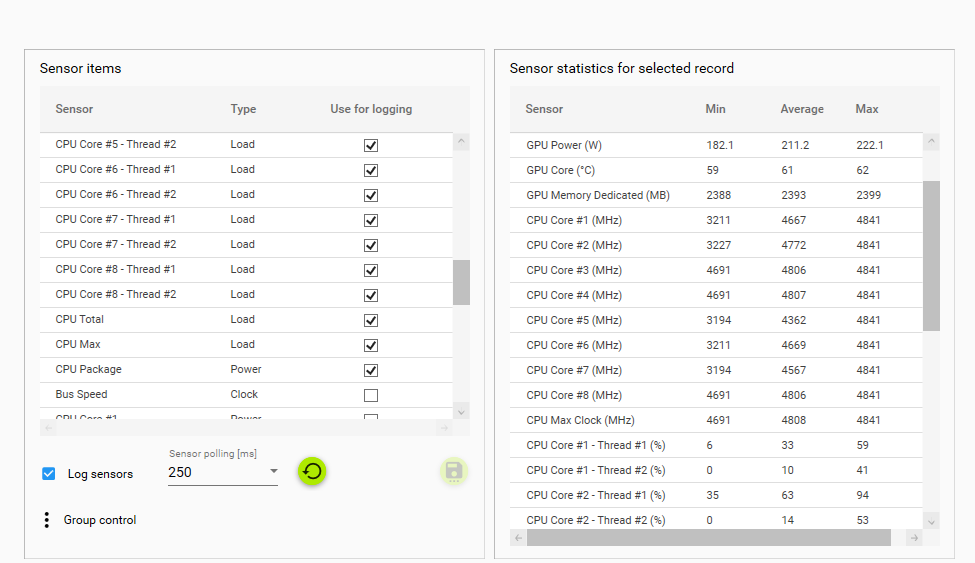
New Sensor page
On this page you have a list of all sensors that are available for logging. The controls for logging activation and logging period are now located here instead of the capture page.
You can choose freely what you want to be logged. The Analysis page still shows you the basic sensors(that are also set as default) while the sensor page shows you all sensors you've logged and like on the Analysis page you can copy the min/avg/max values as well as all the raw values via context menu from here.
Auto deactivate RTSS
To minimize the potential performance impact of the overlay we've added a new option on the overlay page. With this, you can choose to deactivate the global RTSS overlay automatically while a capture is running. After finishing the capture the overlay is activated again.
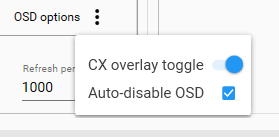
Note: Because CapFrameX is a 64bit app, we can only control the global RTSS overlay hook for other 64bit based processes. For 32bit processes only the CX Overlay will be deactivated.
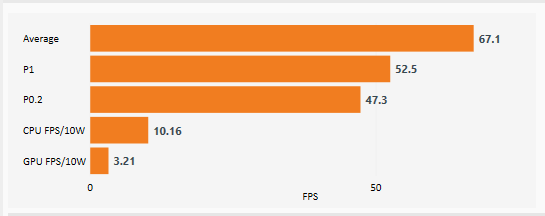
GPU Performance per 10 Watts
Together with the CPU Perf/10W we added GPU Perf/10W. We changed the metric from W to 10W to make the results more visible and thus better comparable in the charts.
Important note: AMD has implemented a new sensor reading in the latest driver that should deliver the total board power for Vega and Navi cards.
In our testing, the values seem a bit lower than expected but definately higher than the previous GPU chip power that should still be reported for Polaris and older cards.
For now, we recommend only to match Nvidia cards with other Nvidia cards and AMD Vega/Navi cards with other Vega/Navi cards when looking for efficiency comparisons.
Enhancements
To further minimize the performance impact of the overlay, sensor polling is now only active for sensors that are either part of the overlay or that are used while logging.
The record list now has an additional context option to copy/paste records into another directory so that you don't have to do this outside of the app.
Hotkey handling has been improved to act more intelligent.
Example: Imagine you have F11 as capture hotkey and want to start a benchmark while running ingame, which is often the Shift key.
As Shift can also be used as a modifier key in combination with other hotkeys, F11 was blocked as long as any modifier key was pressed at the same time.
With the new version, every hotkey has it's own list of possible key combinations so you can hold any modifier key together with the actual hotkey as long as the exact combination you're pressing isn't registered as another hotkey.