With the focus on new overlay options, the new version got quite a few more updates than we initially planned.
Version 1.5.3 is now available in the download section aswell as on github.
New metrics and sorting options
We made some changes to the metrics for analysis and comparison.
For the analysis we've included the "GPU clock" and the "Time in GPU load limit" to the sensor statistics, which you can now also copy to clipboard and we added a "CPU FPS/W" metric on both analysis and comparison page. "GPU FPS/W" would be misleading since AMD and Nvidia don't give you the same values with their sensors, so when we're able to get the "Chip only" power from Nvidia, the values can be compared and we will add this metric too.
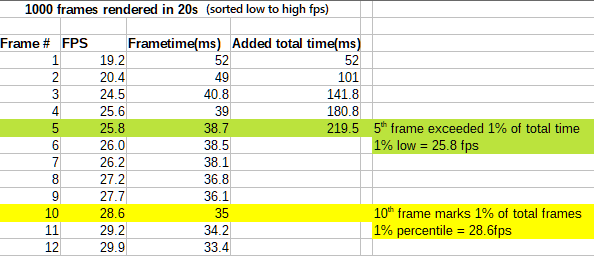
Also we've changed the calculation method for the x% low metrics. Until now 1% low meant the average of the lowest 1% of total frames rendered. We wanted this metric to be more comparable to MSI Afterburners results so we are using their approach from this version on.
Now 1% low is calculated more like a percentile but instead of calculating the value at the border between the lowest 1% and the other 99% of total frames rendered(P1), we're adding the frametime of all lowest frames until they reach a sum of 1% of the total benchmark time(e.g. 200ms for a 20s benchmark). The FPS value that first exceeds this point is the new 1% low. You could also call it a time based 1% percentile.
A quick comparison between the new 1% low and the 1% percentile:
Also you can now manually choose the first metric for comparisons aswell as choose the metric you want your comparison to be sorted by.
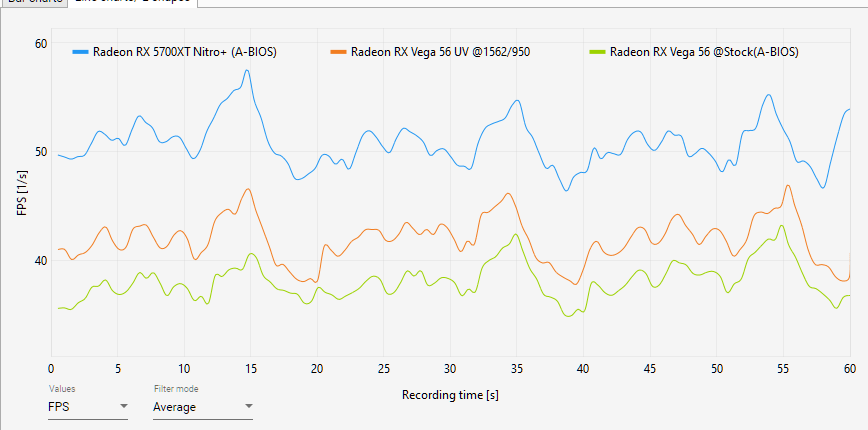
New FPS Graphs
As the raw FPS values can be a bit tricky to analyse and compare, we've added a filter option to show the fps values averaged over a set period of time so you get a more readable FPS trend line that you can now also select on the comparison page.
Of course you still have the option to display the raw data, aswell as a combination of the two for the analysis page.
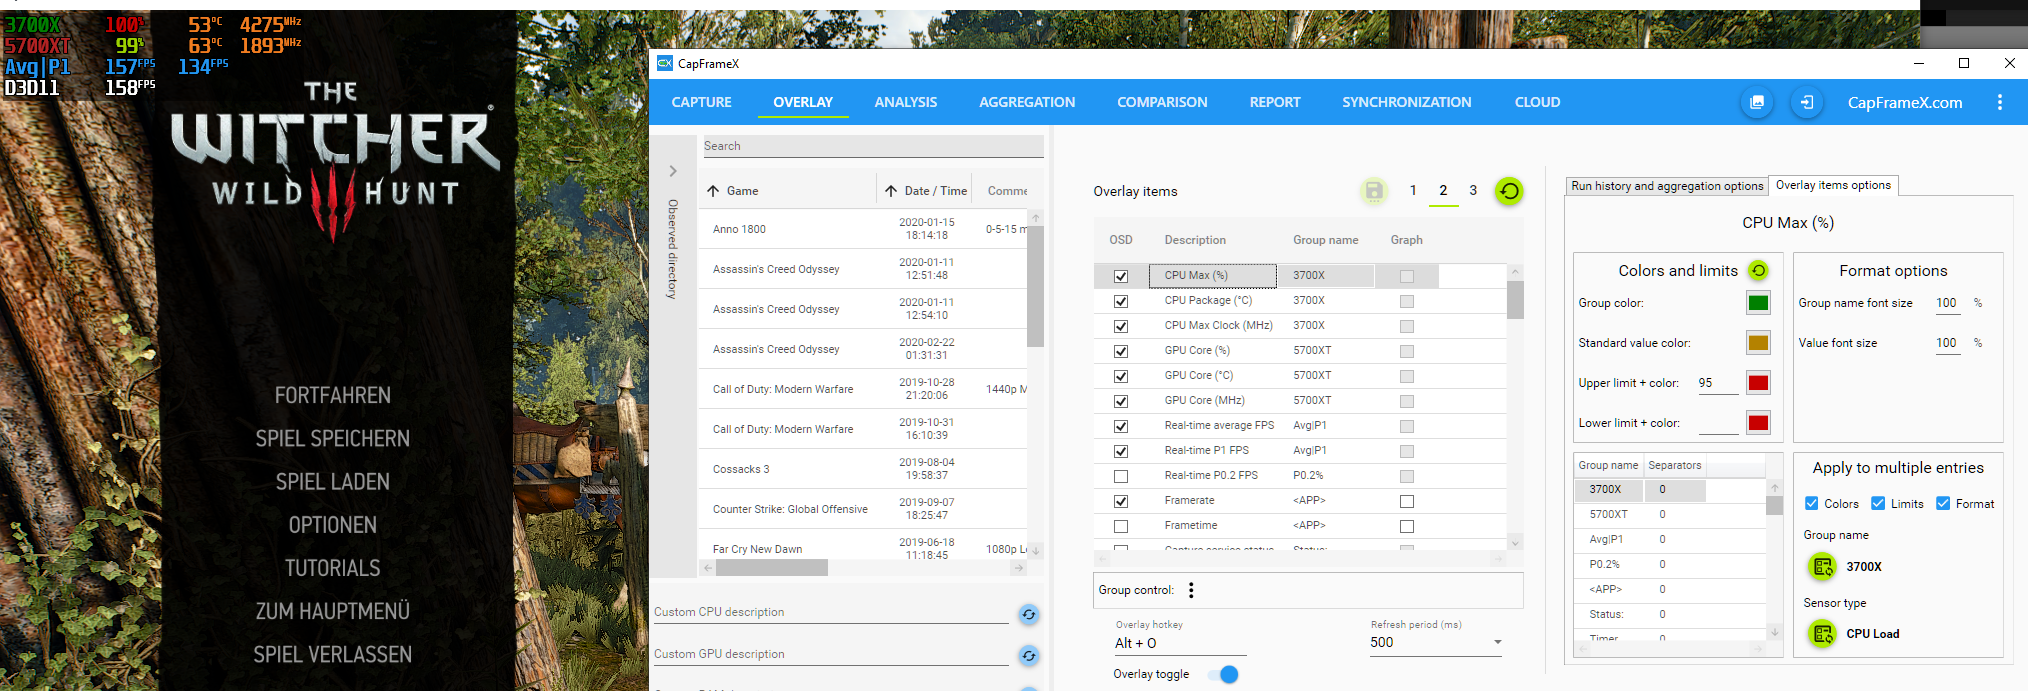
New overlay options
The biggest change for this version is the addition of a new tab on the overlay page.
Here you can set group colors, value colors, value limits, font sizes and group separators for each individual overlay entry aswell as applying these values to all entries with either the same group name or the same type of sensor.
For quicker configuration of your entry list, you can now select or deselect different types of entries directly through the menu below the entry list and also drag and drop multiple entries at once.
Other enhancements
There are many other small details we've changed or added, for example the addition of CPU, GPU and RAM colums in the record list so that you can sort your list by hardware.
The range slider on the analysis page can now also be controlled by typing in specific times and you can cut the record afterwards to create a new file with exactly the timespan you set with the range slider.
Bug fixes
The bugs that may have been encountered by more people were the lack of GPU power sensors for some Nvidia users and the failed capture after which the hotkey was no longer working.
As always the complete changelog is available on Github.