Game Cache vs. RAM Power, Matisse vs. Renoir

First of all, I would like to thank our sponsor Zed Up Gaming PCs for kindly providing us with a Ryzen 5 PRO 4650G. This is not at all a matter of course, as AMD did not initially plan Renoir for the retail market. In this test I'm not interested in the Vega graphics unit on the APU, but in the special tuning potential in relation to the RAM. But that is not the only special feature. Because AMD is pursuing a monolithic design with Renoir, the intercore latencies turn out better. I will prove this with appropriate benchmarks. On the other hand, the Ryzen 5 Pro has comparatively little L3 cache with just 8 MiB. So the question I want to answer with this test is this: Can Renoir with its special tuning potential and lower intercore latencies overcompensate for the small L3 cache and perhaps even beat Matisse?

The test systems

Matisse

  • CPU: Ryzen 9 3950X 6 Core Configuration (1 CCD and 3-3 CCX)
  • Cooler: be quiet! Dark Rock PRO 4 
  • Board: X470 ASRock Taichi
  • RAM: 4x8 G.Skill Trident Z 3800MT/s CL16
  • GPU: SAPPHIRE Pulse RX 5700@1800MHz +20% PL 

Renoir

  • CPU: Ryzen 5 PRO 4650G
  • Cooler: be quiet! Dark Rock PRO 4
  • Board: X570 Gigabyte Aorus Master F21 BIOS
  • RAM: 4x8 G.Skill Trident Z 4200MT/s CL16
  • GPU: SAPPHIRE Pulse RX 5700@1800MHz +20% PL 

The test systems are configured so that max OC competes against max OC. However, the "max" must be considered relatively. I did the RAM tuning as good as I could. Although I'm not a professional, the results are impressive. Of course there was help from the RAM OC community (Discord). Thanks for that at this point. The core clock potential of the Renoir APU turns out rather modest at around 4.3GHz at 1.4V. To my surprise the gaming performance with fixed core clock was even slightly worse, so the APU ran on Auto in the gaming benchmarks, whereas the 3950X was clocked with 4.5GHz. This might seem unfair at first glance, but it is exactly the configuration with which both opponents showed the best performance. The 3950X thus most closely corresponds to a 3600XT, which can be clocked at around 4.5GHz thanks to the somewhat better manufacturing process. Both the Renoir APU and the Matisse CPU are not pushed to the limit and offer further optimization potential. But this makes the comparison more realistic, because not everyone is an ambitious overclocker. It should be stressed that no IPC comparisons are made. The test aims at what can realistically be got out of the hardware by normal OC. Leaving the Matisse CPU unoverclocked would not be fair, because Ryzen 3000 also offers a solid optimization potential.

Application benchmarks

AIDA64 Extreme

Let's first take a look at the latencies and bandwidths of the memory hierarchy, which the AIDA64 Cache & Memory Benchmark tells us.


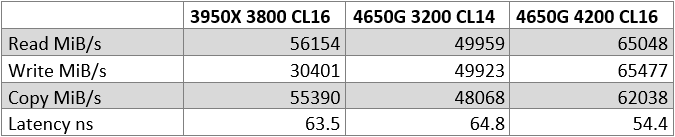
The tuned Ryzen 4000 can clearly stand out, both in terms of latency and bandwidth. The RAM latency, which is important for gaming performance, is about 14% better in comparison to the also tuned Matisse. The read bandwidth is even about 16% faster. Because there is no bottleneck in the connection (number of lanes) to the I/O die, the write throughput corresponds to the read throughput, as we already know from Zen and Zen+.

SisSoftware Sandra intercore latency test

Benchmark Results
Inter-Core Bandwidth : 57.31GB/s
Results Interpretation : Higher Scores mean Better Performance.
Binary Numeral System (base 2) : 1GB(/s) = 1024MB(/s), 1MB(/s) = 1024kB(/s), 1kB(/s) = 1024 bytes(/s), etc.
 
Benchmark Results
Inter-Core Latency : 56.7ns
Results Interpretation : Lower Scores mean Better Performance.
Decimal Numeral System (base 10) : 1s = 1000ms, 1ms = 1000µs, 1µs = 1000ns, etc.
 
Performance per Thread
Inter-Core Bandwidth : 3.58GB/s
No. Threads : 16
Results Interpretation : Higher Scores mean Better Performance.
Binary Numeral System (base 2) : 1GB(/s) = 1024MB(/s), 1MB(/s) = 1024kB(/s), 1kB(/s) = 1024 bytes(/s), etc.
 
Performance vs. Speed
Inter-Core Bandwidth : 13.34MB/s/MHz
Results Interpretation : Higher Scores mean Better Performance.
Inter-Core Latency : 0.13ns/MHz
Results Interpretation : Lower Scores mean Better Performance.
 
Detailed Results
Processor Affinity : U0-U1 U2-U3 U4-U5 U6-U7 U8-U9 U10-U11 U12-U13 U14-U15
U0-U1 Data Latency : 25.8ns
U0-U2 Data Latency : 26.3ns
U0-U3 Data Latency : 26.1ns
U0-U4 Data Latency : 64.7ns
U0-U5 Data Latency : 64.7ns
U0-U6 Data Latency : 64.6ns
U0-U7 Data Latency : 64.9ns
U0-U8 Data Latency : 62.9ns
U0-U9 Data Latency : 63.4ns
U0-U10 Data Latency : 63.1ns
U0-U11 Data Latency : 63.6ns
U0-U12 Data Latency : 63.2ns
U0-U13 Data Latency : 63.7ns
U0-U14 Data Latency : 63.5ns
U0-U15 Data Latency : 63.4ns
U1-U2 Data Latency : 28.2ns
U1-U3 Data Latency : 26.1ns
U1-U4 Data Latency : 65.1ns
U1-U5 Data Latency : 64.9ns
U1-U6 Data Latency : 65.0ns
U1-U7 Data Latency : 65.7ns
U1-U8 Data Latency : 64.1ns
U1-U9 Data Latency : 63.5ns
U1-U10 Data Latency : 63.6ns
U1-U11 Data Latency : 64.1ns
U1-U12 Data Latency : 64.1ns
U1-U13 Data Latency : 63.9ns
U1-U14 Data Latency : 63.3ns
U1-U15 Data Latency : 64.0ns
U2-U3 Data Latency : 28.7ns
U2-U4 Data Latency : 64.7ns
U2-U5 Data Latency : 63.6ns
U2-U6 Data Latency : 64.0ns
U2-U7 Data Latency : 64.3ns
U2-U8 Data Latency : 62.9ns
U2-U9 Data Latency : 62.7ns
U2-U10 Data Latency : 63.2ns
U2-U11 Data Latency : 64.6ns
U2-U12 Data Latency : 63.8ns
U2-U13 Data Latency : 63.3ns
U2-U14 Data Latency : 64.0ns
U2-U15 Data Latency : 64.2ns
U3-U4 Data Latency : 65.1ns
U3-U5 Data Latency : 64.2ns
U3-U6 Data Latency : 65.0ns
U3-U7 Data Latency : 64.6ns
U3-U8 Data Latency : 63.6ns
U3-U9 Data Latency : 63.3ns
U3-U10 Data Latency : 64.9ns
U3-U11 Data Latency : 64.2ns
U3-U12 Data Latency : 63.8ns
U3-U13 Data Latency : 63.5ns
U3-U14 Data Latency : 64.2ns
U3-U15 Data Latency : 64.3ns
U4-U5 Data Latency : 25.6ns
U4-U6 Data Latency : 26.2ns
U4-U7 Data Latency : 26.1ns
U4-U8 Data Latency : 64.2ns
U4-U9 Data Latency : 62.7ns
U4-U10 Data Latency : 63.5ns
U4-U11 Data Latency : 62.5ns
U4-U12 Data Latency : 64.1ns
U4-U13 Data Latency : 62.9ns
U4-U14 Data Latency : 63.9ns
U4-U15 Data Latency : 63.3ns
U5-U6 Data Latency : 26.1ns
U5-U7 Data Latency : 26.5ns
U5-U8 Data Latency : 63.4ns
U5-U9 Data Latency : 62.9ns
U5-U10 Data Latency : 64.2ns
U5-U11 Data Latency : 63.4ns
U5-U12 Data Latency : 63.3ns
U5-U13 Data Latency : 63.1ns
U5-U14 Data Latency : 63.7ns
U5-U15 Data Latency : 63.4ns
U6-U7 Data Latency : 25.5ns
U6-U8 Data Latency : 63.9ns
U6-U9 Data Latency : 63.3ns
U6-U10 Data Latency : 64.7ns
U6-U11 Data Latency : 64.4ns
U6-U12 Data Latency : 63.8ns
U6-U13 Data Latency : 63.7ns
U6-U14 Data Latency : 64.6ns
U6-U15 Data Latency : 64.4ns
U7-U8 Data Latency : 63.7ns
U7-U9 Data Latency : 63.2ns
U7-U10 Data Latency : 65.1ns
U7-U11 Data Latency : 64.3ns
U7-U12 Data Latency : 63.8ns
U7-U13 Data Latency : 63.5ns
U7-U14 Data Latency : 64.6ns
U7-U15 Data Latency : 64.4ns
U8-U9 Data Latency : 25.6ns
U8-U10 Data Latency : 26.0ns
U8-U11 Data Latency : 28.5ns
U8-U12 Data Latency : 66.2ns
U8-U13 Data Latency : 65.4ns
U8-U14 Data Latency : 66.1ns
U8-U15 Data Latency : 66.5ns
U9-U10 Data Latency : 26.1ns
U9-U11 Data Latency : 26.5ns
U9-U12 Data Latency : 65.5ns
U9-U13 Data Latency : 66.6ns
U9-U14 Data Latency : 66.3ns
U9-U15 Data Latency : 66.4ns
U10-U11 Data Latency : 20.0ns
U10-U12 Data Latency : 66.1ns
U10-U13 Data Latency : 66.2ns
U10-U14 Data Latency : 66.5ns
U10-U15 Data Latency : 66.7ns
U11-U12 Data Latency : 66.7ns
U11-U13 Data Latency : 65.7ns
U11-U14 Data Latency : 66.6ns
U11-U15 Data Latency : 66.4ns
U12-U13 Data Latency : 25.6ns
U12-U14 Data Latency : 28.8ns
U12-U15 Data Latency : 26.1ns
U13-U14 Data Latency : 26.1ns
U13-U15 Data Latency : 26.6ns
U14-U15 Data Latency : 25.3ns
1x 64bytes Blocks Bandwidth : 2.55GB/s
4x 64bytes Blocks Bandwidth : 5.67GB/s
4x 256bytes Blocks Bandwidth : 21.7GB/s
4x 1kB Blocks Bandwidth : 73.73GB/s
4x 4kB Blocks Bandwidth : 113.62GB/s
16x 4kB Blocks Bandwidth : 130.76GB/s
4x 64kB Blocks Bandwidth : 159GB/s
16x 64kB Blocks Bandwidth : 223.18GB/s
8x 256kB Blocks Bandwidth : 436.64GB/s
4x 1MB Blocks Bandwidth : 377.08GB/s
8x 1MB Blocks Bandwidth : 39.07GB/s
8x 4MB Blocks Bandwidth : 16GB/s
 
Benchmark Status
Result ID : AMD Ryzen 9 3950X 16-Core Processor (16C 4.4GHz, 1.87GHz IMC, 16x 512kB L2, 4x 16MB L3)
Microcode : MU8F710013
Computer : ASRock X470 Taichi
Platform Compliance : x64
Buffering Used : No
No. Threads : 16
System Timer : 10MHz
 
Processor
Model : AMD Ryzen 9 3950X 16-Core Processor
Speed : 4.4GHz (100%)
Min/Max/Turbo Speed : 2.2GHz - 3.5GHz - 4.4GHz
Cores per Processor : 16 Unit(s)
Threads per Core : 1 Unit(s)
Front Side Bus Speed : 100MHz
Revision/Stepping : 71 / 0
Microcode : MU8F710013
L1D (1st Level) Data Cache : 16x 32kB, 8-Way, Exclusive, 64bytes Line Size
L1I (1st Level) Code Cache : 16x 32kB, 8-Way, Exclusive, 64bytes Line Size
L2 (2nd Level) Data/Unified Cache : 16x 512kB, 8-Way, Fully Inclusive, 64bytes Line Size
L3 (3rd Level) Data/Unified Cache : 4x 16MB, 16-Way, Exclusive, 64bytes Line Size, 4 Thread(s)
 
Memory Controller
Speed : 1.87GHz (100%)
Min/Max/Turbo Speed : 933MHz - 1.87GHz
 
Benchmark Results
Inter-Core Bandwidth : 54.92GB/s
Results Interpretation : Higher Scores mean Better Performance.
Binary Numeral System (base 2) : 1GB(/s) = 1024MB(/s), 1MB(/s) = 1024kB(/s), 1kB(/s) = 1024 bytes(/s), etc.
 
Benchmark Results
Inter-Core Latency : 34.3ns
Results Interpretation : Lower Scores mean Better Performance.
Decimal Numeral System (base 10) : 1s = 1000ms, 1ms = 1000µs, 1µs = 1000ns, etc.
 
Performance per Thread
Inter-Core Bandwidth : 4.58GB/s
No. Threads : 12
Results Interpretation : Higher Scores mean Better Performance.
Binary Numeral System (base 2) : 1GB(/s) = 1024MB(/s), 1MB(/s) = 1024kB(/s), 1kB(/s) = 1024 bytes(/s), etc.
 
Performance vs. Speed
Inter-Core Bandwidth : 13.08MB/s/MHz
Results Interpretation : Higher Scores mean Better Performance.
Inter-Core Latency : 0.08ns/MHz
Results Interpretation : Lower Scores mean Better Performance.
 
Detailed Results
Processor Affinity : U0-U1 U2-U3 U4-U5 U6-U7 U8-U9 U10-U11
U0-U2 Data Latency : 21.7ns
U0-U4 Data Latency : 21.2ns
U0-U6 Data Latency : 44.5ns
U0-U8 Data Latency : 45.1ns
U0-U10 Data Latency : 46.6ns
U0-U1 Data Latency : 11.8ns
U0-U3 Data Latency : 21.4ns
U0-U5 Data Latency : 21.2ns
U0-U7 Data Latency : 44.5ns
U0-U9 Data Latency : 45.2ns
U0-U11 Data Latency : 46.8ns
U2-U4 Data Latency : 23.3ns
U2-U6 Data Latency : 46.1ns
U2-U8 Data Latency : 46.1ns
U2-U10 Data Latency : 47.8ns
U2-U1 Data Latency : 21.8ns
U2-U3 Data Latency : 11.8ns
U2-U5 Data Latency : 23.2ns
U2-U7 Data Latency : 45.3ns
U2-U9 Data Latency : 46.7ns
U2-U11 Data Latency : 47.4ns
U4-U6 Data Latency : 46.3ns
U4-U8 Data Latency : 46.8ns
U4-U10 Data Latency : 48.0ns
U4-U1 Data Latency : 21.1ns
U4-U3 Data Latency : 23.2ns
U4-U5 Data Latency : 11.8ns
U4-U7 Data Latency : 46.3ns
U4-U9 Data Latency : 47.1ns
U4-U11 Data Latency : 47.3ns
U6-U8 Data Latency : 21.3ns
U6-U10 Data Latency : 21.1ns
U6-U1 Data Latency : 45.1ns
U6-U3 Data Latency : 44.6ns
U6-U5 Data Latency : 46.4ns
U6-U7 Data Latency : 11.8ns
U6-U9 Data Latency : 21.3ns
U6-U11 Data Latency : 21.1ns
U8-U10 Data Latency : 23.1ns
U8-U1 Data Latency : 46.1ns
U8-U3 Data Latency : 46.4ns
U8-U5 Data Latency : 47.2ns
U8-U7 Data Latency : 21.6ns
U8-U9 Data Latency : 11.8ns
U8-U11 Data Latency : 23.1ns
U10-U1 Data Latency : 46.5ns
U10-U3 Data Latency : 47.0ns
U10-U5 Data Latency : 48.0ns
U10-U7 Data Latency : 21.2ns
U10-U9 Data Latency : 23.2ns
U10-U11 Data Latency : 11.8ns
U1-U3 Data Latency : 21.4ns
U1-U5 Data Latency : 21.1ns
U1-U7 Data Latency : 44.4ns
U1-U9 Data Latency : 45.0ns
U1-U11 Data Latency : 46.7ns
U3-U5 Data Latency : 23.2ns
U3-U7 Data Latency : 46.0ns
U3-U9 Data Latency : 46.8ns
U3-U11 Data Latency : 47.7ns
U5-U7 Data Latency : 46.3ns
U5-U9 Data Latency : 47.1ns
U5-U11 Data Latency : 48.1ns
U7-U9 Data Latency : 21.3ns
U7-U11 Data Latency : 21.1ns
U9-U11 Data Latency : 23.1ns
1x 64bytes Blocks Bandwidth : 8.67GB/s
4x 64bytes Blocks Bandwidth : 15.26GB/s
4x 256bytes Blocks Bandwidth : 56.73GB/s
4x 1kB Blocks Bandwidth : 161.7GB/s
4x 4kB Blocks Bandwidth : 260.6GB/s
16x 4kB Blocks Bandwidth : 230.07GB/s
4x 64kB Blocks Bandwidth : 262.73GB/s
16x 64kB Blocks Bandwidth : 242.89GB/s
8x 256kB Blocks Bandwidth : 34GB/s
4x 1MB Blocks Bandwidth : 16.93GB/s
8x 1MB Blocks Bandwidth : 16.79GB/s
8x 4MB Blocks Bandwidth : 16.75GB/s
 
Benchmark Status
Result ID : AMD Ryzen 5 PRO 4650G with Radeon Graphics (6C 12T 4.3GHz, 2.1GHz IMC, 6x 512kB L2, 2x 4MB L3)
Microcode : MU8F600103
Computer : GigaByte X570 AORUS MASTER X570 MB
Platform Compliance : x64
Buffering Used : No
No. Threads : 12
System Timer : 10MHz
 
Processor
Model : AMD Ryzen 5 PRO 4650G with Radeon Graphics
Speed : 4.3GHz (100%)
Min/Max/Turbo Speed : 1.4GHz - 3.7GHz - 4.3GHz
Cores per Processor : 6 Unit(s)
Cores per Compute Unit : 2 Unit(s)
Front Side Bus Speed : 100MHz
Revision/Stepping : 60 / 1
Microcode : MU8F600103
L1D (1st Level) Data Cache : 6x 32kB, 8-Way, Exclusive, 64bytes Line Size, 2 Thread(s)
L1I (1st Level) Code Cache : 6x 32kB, 8-Way, Exclusive, 64bytes Line Size, 2 Thread(s)
L2 (2nd Level) Data/Unified Cache : 6x 512kB, 8-Way, Fully Inclusive, 64bytes Line Size, 2 Thread(s)
L3 (3rd Level) Data/Unified Cache : 2x 4MB, 16-Way, Exclusive, 64bytes Line Size, 8 Thread(s)
 
Memory Controller
Speed : 2.1GHz (100%)
Min/Max/Turbo Speed : 1GHz - 2.1GHz
 
 
The inter CCX latencies with an average of 46ns are significantly better in comparison to the chiplet design of the Matisse CPU. With about 64ns on average, these are 40% higher latencies. The intra CCX latencies are comparable. Whether the slightly better intra CCX latencies of the 4650G are due to measurement accuracy is difficult to answer. Basically, this shouldn't lead to significant differences in terms of architecture.
 

7-Zip

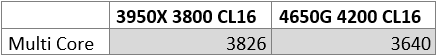
Next we look at the compression and decompression performance.

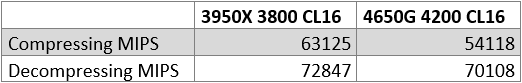
Compression performance differs significantly, while decompression is comparable. Many factors play a role here that can influence the results. One should not ignore the power limit of the APU. The cache, on the other hand, will make the main difference.

Packetwise memory accesses

This benchmark is my own development. The memory accesses are randomized. The duration of the processing of different packet sizes is measured. This presents the levels of the memory hierarchy.

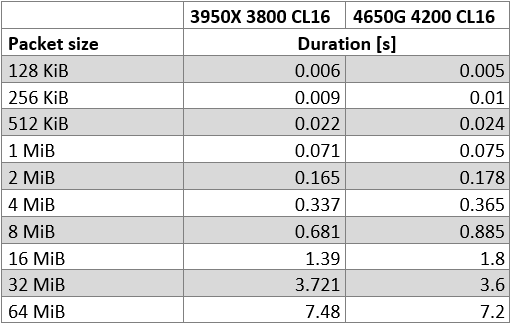
In addition to the tabular form, the data is also displayed as a curve diagram, which better illustrates the differences from 4 MiB upwards.

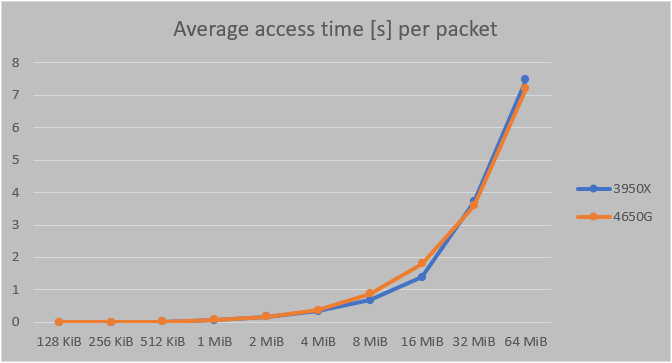
As expected, the processing time from 4 MiB on the 3950X is lower because the R9 has more L3 cache. Just before the 32 MiB mark, the curves converge again because the accesses mostly run over the RAM. The 4650G's faster memory shows its effect here. The blue curve runs from this mark above the orange curve.

Cinebench R20

Of course Cinebench must not be missing in application benchmarks.

Although the power limit slows the 4650G down, the rates are only marginally apart. Cinebench is indeed very cache-heavy, but the smaller cache is still completely sufficient. A similar thing could already be observed in the 2400G and 3400G.

Geekbench 5

Geekbench is a popular suite that combines many different individual tests. Version 5 is not as RAM sensitive as its predecessor, making the suite very suitable for IPC considerations by the way.

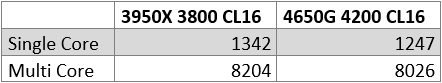
The single core score turns out higher as expected due to the higher boost clock. The multi core score is somewhat lower due to the power limit. The higher RAM performance does not help the Renoir APU here.

Game benchmarks

The main focus of this test is on the game benchmarks, which we will now take a closer look at. The question mentioned in the introduction, whether the better tuning potential of the memory can compensate for the smaller L3 cache, shall now be answered. How important is the L3 cache really for gaming performance? The memory tests already give an idea of how the results will turn out.  The course consists of 7 known AAA titles, which cover all common APIs. There is a YouTube video for each scene to provide maximum transparency. Furthermore all settings are given. The resolution is 720p, to fulfill all requirements for a proper ranking. Comparisons in which faster hardware is limited upwards by other components, such as the graphics card, are not only unfair, but basically even invalid.
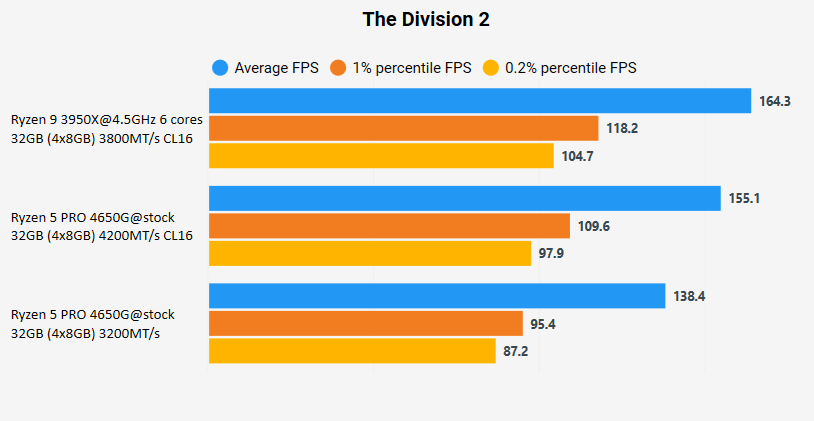
The Division 2

  • Scene: Youtube
  • Settings: 720p, ultra preset, AA/AF/AO min, 50% render scale, 18:00 world time (photo mode)
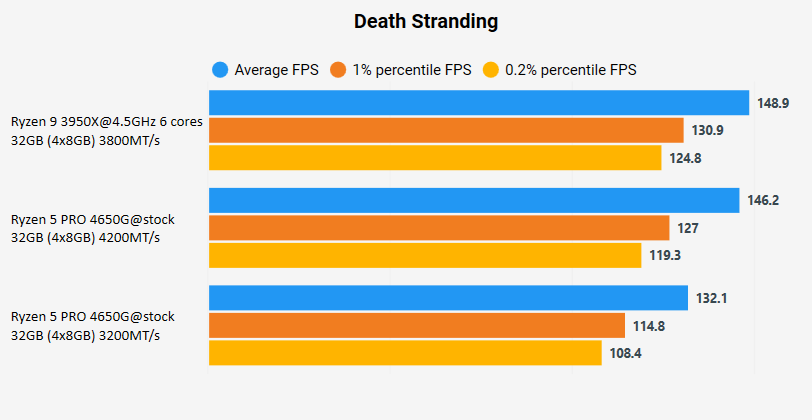
Death Stranding

  • Scene: Youtube
  • Settings: 720p, very high, AA/AO min, post processing + CAS off

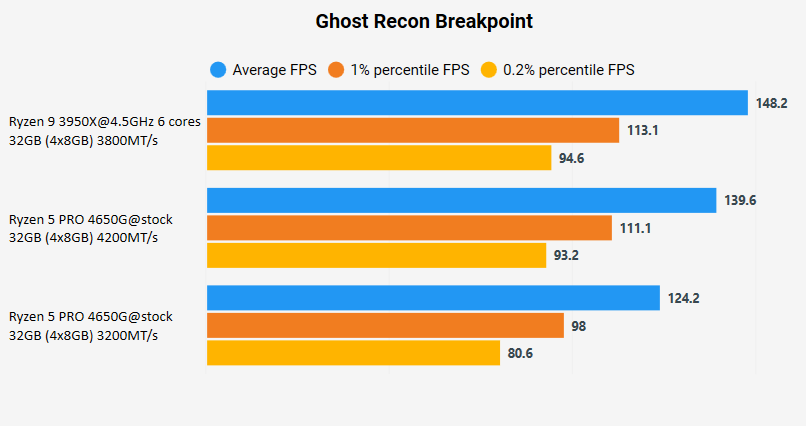
Ghost Recon Breakpoint

  • Scene: Youtube
  • Settings: 720p, 80% render scale, details very high, terrain and gras quality very high, everything else min or off
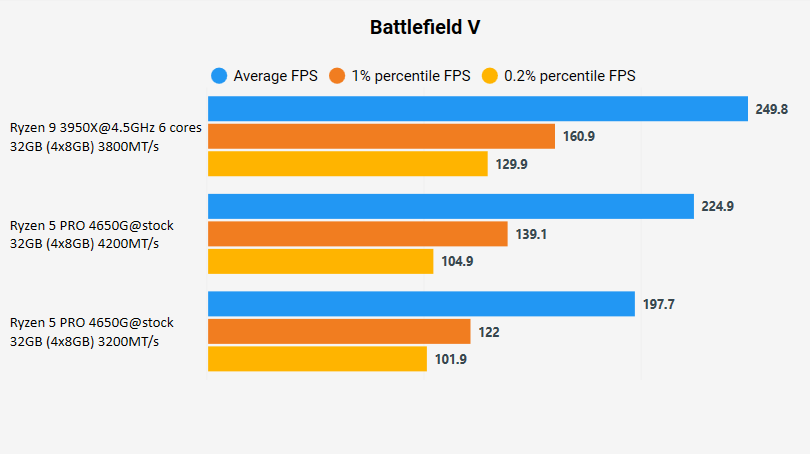
Battlefield V

  • Scene: Youtube
  • Settings: 720p, 25% render scale, AF/AA/AO min, post processing off, mesh quality low
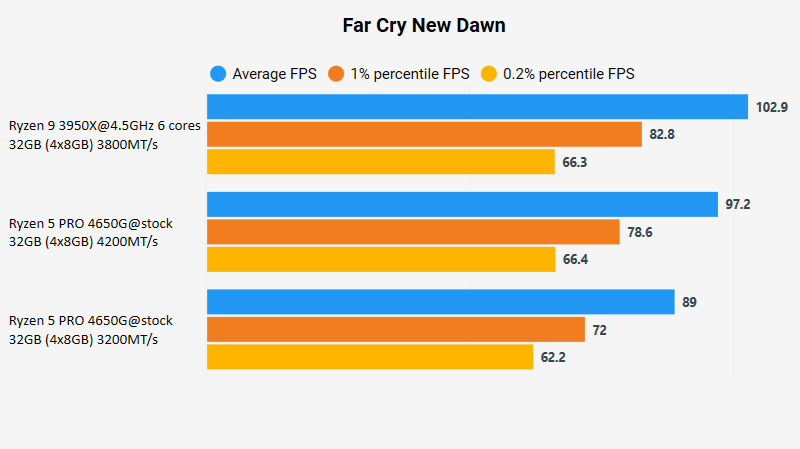
Far Cry New Dawn

  • Scene: Youtube
  • Settings: 720p, ultra preset, AA/AF min, low texture quality, blur off

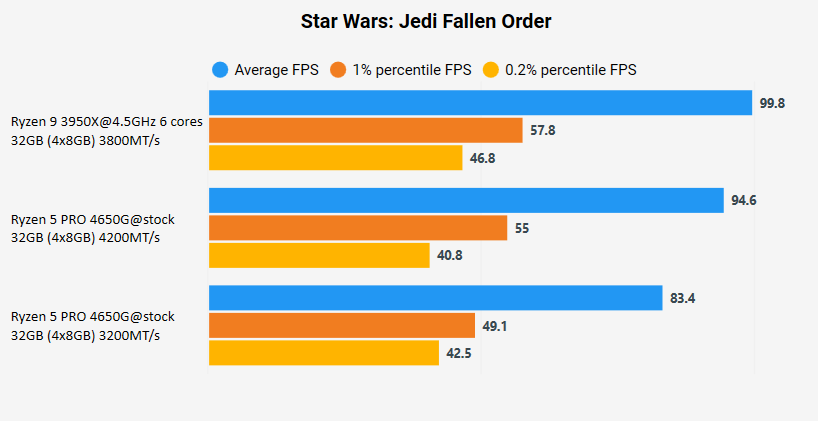
Star Wars: Jedi Fallen Order

  • Scene: Youtube
  • Settings: 720p, epic preset, AA/AF min, post processing off

Metro Exodus

  • Scene: Youtube
  • Settings: 720p, ultra preset, AF min, Hairworks off, tesslation off

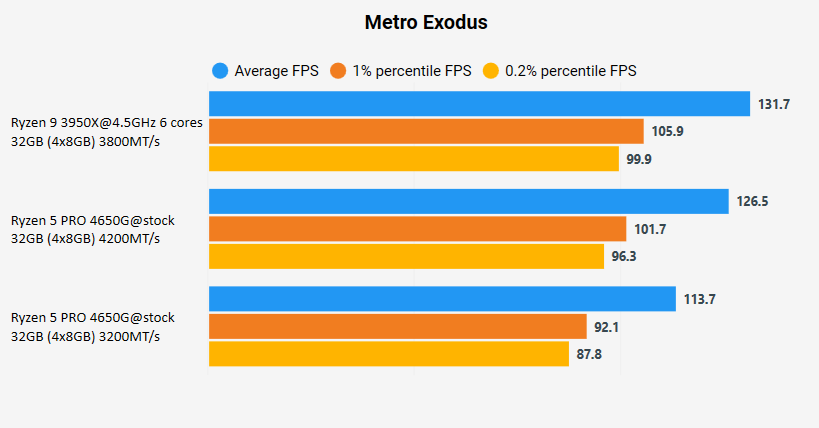
The optimization potential of RAM OC is considerable. The clearly better latencies (RAM and intercore) don't help to overtake Matisse, though. The CPU's clock difference only plays a minor role (probably about 3%). The importance of the L3 cache for the gaming performance becomes abundantly clear. Here you can already guess what performance increases Zen 3 could bring with it through the uniform, 32MiB large L3 cache or "Game Cache", as AMD calls it. 

Conclusion

The application performance of the Ryzen 4000 APU is impressive and falls only slightly behind the Matisse CPU. Only the 7-Zip compression benchmark differs significantly. The single core performance is understandably lower due to the lower boost clock rates.

The gaming performance is comparable, but this has to be "fought" with relatively tight RAM OC. The tuning potential is undoubtedly considerable and can be used by enthusiasts. In spite of the significant extra performance compared to the configuration according to the specification, the "Game Cache" wins in the game benchmarks.

Tags:RAM OCRenoirgame benchmarkslatenciesGame Cache4650GAPU

RAM OC, Renoir, game benchmarks, latencies, Game Cache, 4650G, APU
CapFrameX Frametime Analysis Software
Back to overview

Featured Blogposts

metrics explained
Explanation of different performance metrics
5/31/20

Frametimes, FPS, median, Percentiles, x%-low ?

Continue reading
post teaser thumbnail
how capframex calculates fps
The challenge of displaying performance metrics as FPS
6/27/20

Why does my analysis show fps values that are lower than what I've seen in the game?

Continue reading
post teaser thumbnail